View Test Results
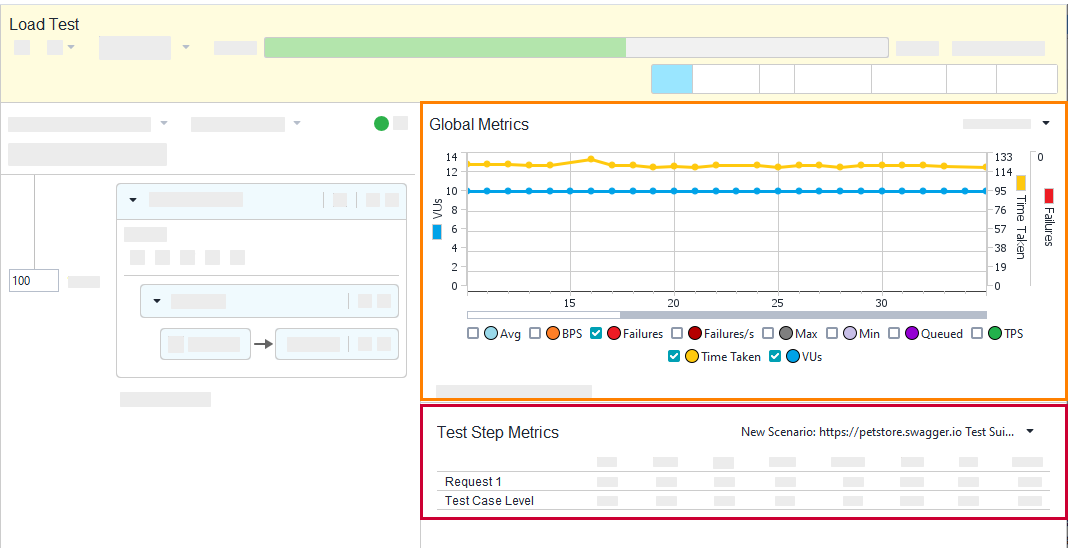
While ReadyAPI is running a load test, it collects data on the service performance. You can see the collected data in the Global Metrics graph, in the Test Step Metrics table and on the Statistics page.
 |
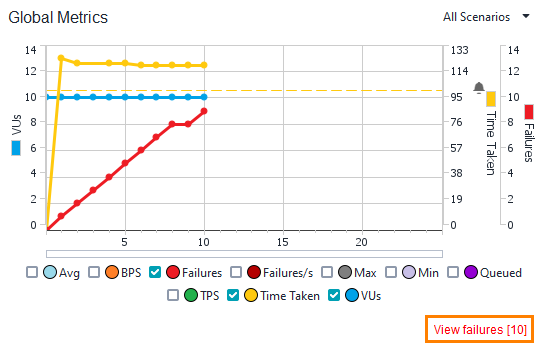
The Global Metrics graph shows how various performance metrics of your target web service change over time. Examine the VUs/s (the number of users arriving at the server each second), Time taken (time taken for each request), TPS (transactions per second) and BPS (bytes per second) metrics to find out how your target service performs.
If an error occurs during the test, ReadyAPI shows a message below the Global Metrics graph. Click the message to view a detailed description of the error on the Performance Log tab.
 |
The Test Step Metrics table contains performance values of individual test steps, such as the maximum and minimum time it took to simulate each of them.
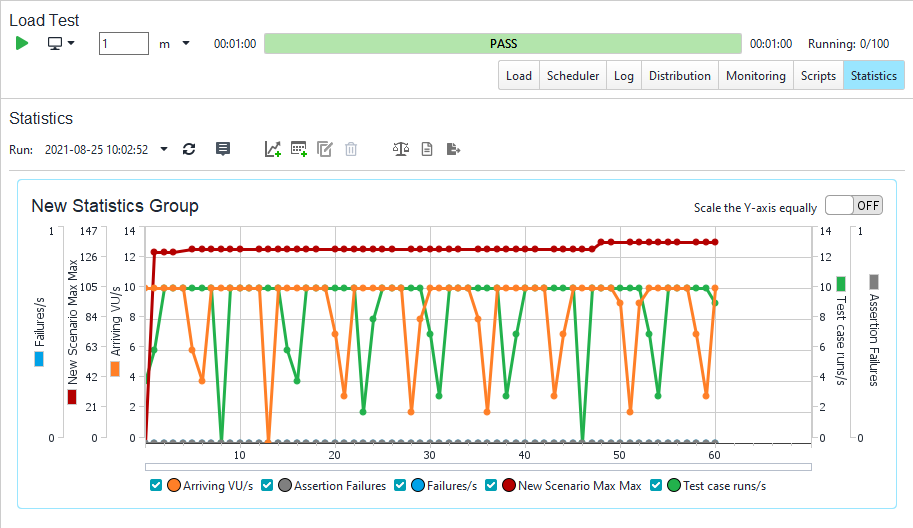
To view and check other statistics of your test runs, switch to the Statistics page (you need a ReadyAPI Performance license for this. Feel free to request a trial on our web site).
Tip
You can also configure server monitors and analyze the server metrics on this page.
 |
You can learn more about adding metrics to the Statistics page here: Adding and Configuring Statistics Groups.
And here is the reference describing the meaning of various metrics: Statistics and Metrics Reference.