BitBar Browser Testing
BitBar Live Browser Testing is a quick and easy way to test your web pages. You can run a live test to see if the app behaves the way you would expect it to during regular use.
Before you start
With BitBar Live Browser Testing, you can test your websites or applications running on local networks using the available browsers. To utilize your local resources, you will need to establish a secure tunnel before commencing live testing. For further details, consult SecureTunnel.
Start the Test
Click Start a Browser Live Test on the dashboard to test your web application or website:
 |
Note
You can also start the test from the left-hand side panel.
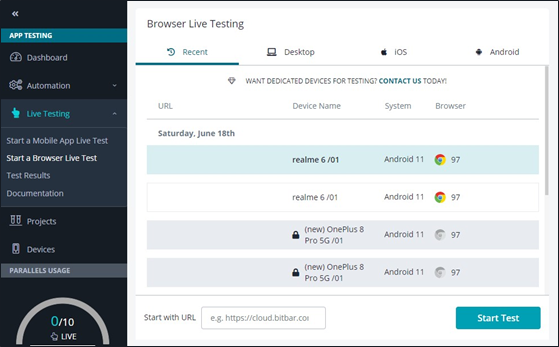
The Browser Live Testing page shows automatically.
 |
Configure the Test
BitBar browser live testing allows you to test your websites on your desktop or mobile browsers and to select your operating system, browser version, and display resolution.
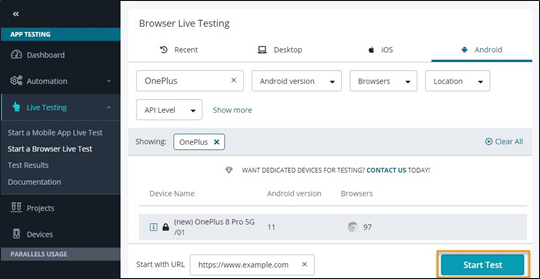
On the Browser Live Testing page, select the specific operating system tab or an available device on which you want to run the test.
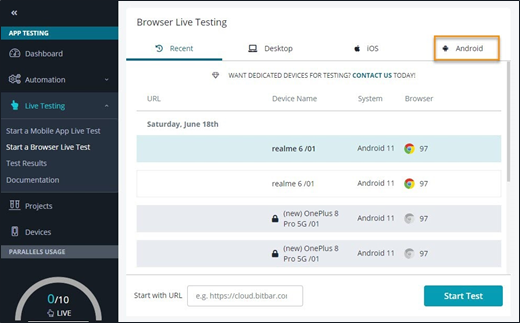
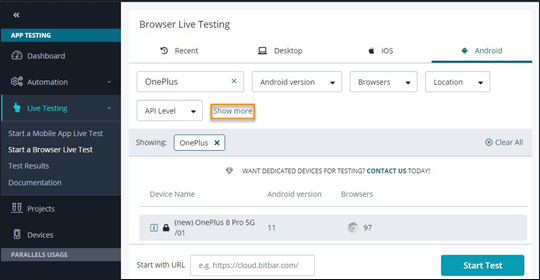
Click on Show More to see all the available filters and narrow down the list of options by using those filtering options.
In the Start with URL textbox, type or paste the link, if you want the test to start immediately at your target URL.
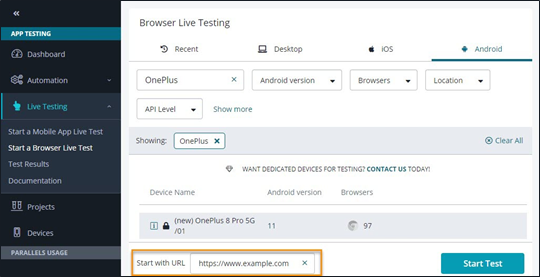
Click Start Test.
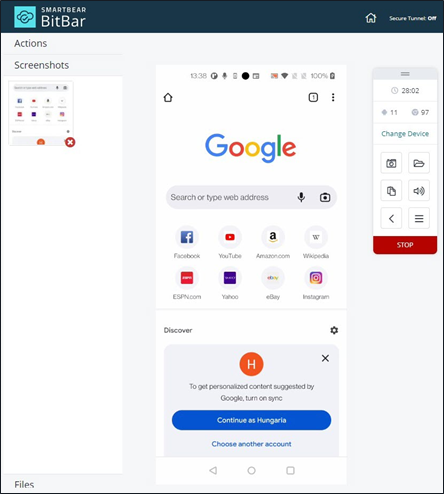
Your test starts by default and the browser opens in the full-screen mode. This allows you to interact with a tested web page with your selected browser.
Note
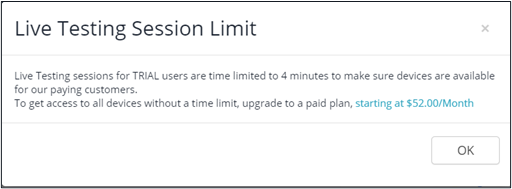
If you are using a trial access, your testing time is limited to four minutes per session.
After five minutes of inactivity during Live Testing, the Yes, I'm still testing button will appear. A two-minute countdown to close the session will begin.
If you miss the countdown, you will find information about the reason for the session timeout on the result page.
Registering User Actions
Registering User Actions allows you to perform test-based activities needed to complete the test and analyze the desired data and results.
After the test starts, you can perform the following activities from the menu on the left side.
Click Start recording to record your actions.
Note
When the browser or the device is ready for testing, the toolbar is displayed on the right side.
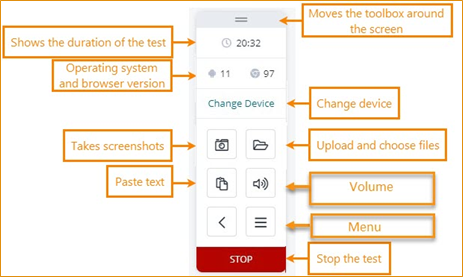
From the toolbar, click the icon to take screenshots.
In the Screenshots section on the left panel, the screenshots will be displayed.
Under Files on the left side, click Upload or choose files to upload or select the files.
Click Change Device to switch to a new browser or device which will terminate your current testing session and return you to the browser/device selection options.
Note
This view may differ based on the device type you have decided to use for the test.
Click STOP to finish your test.
The Device Session page is displayed with the details.
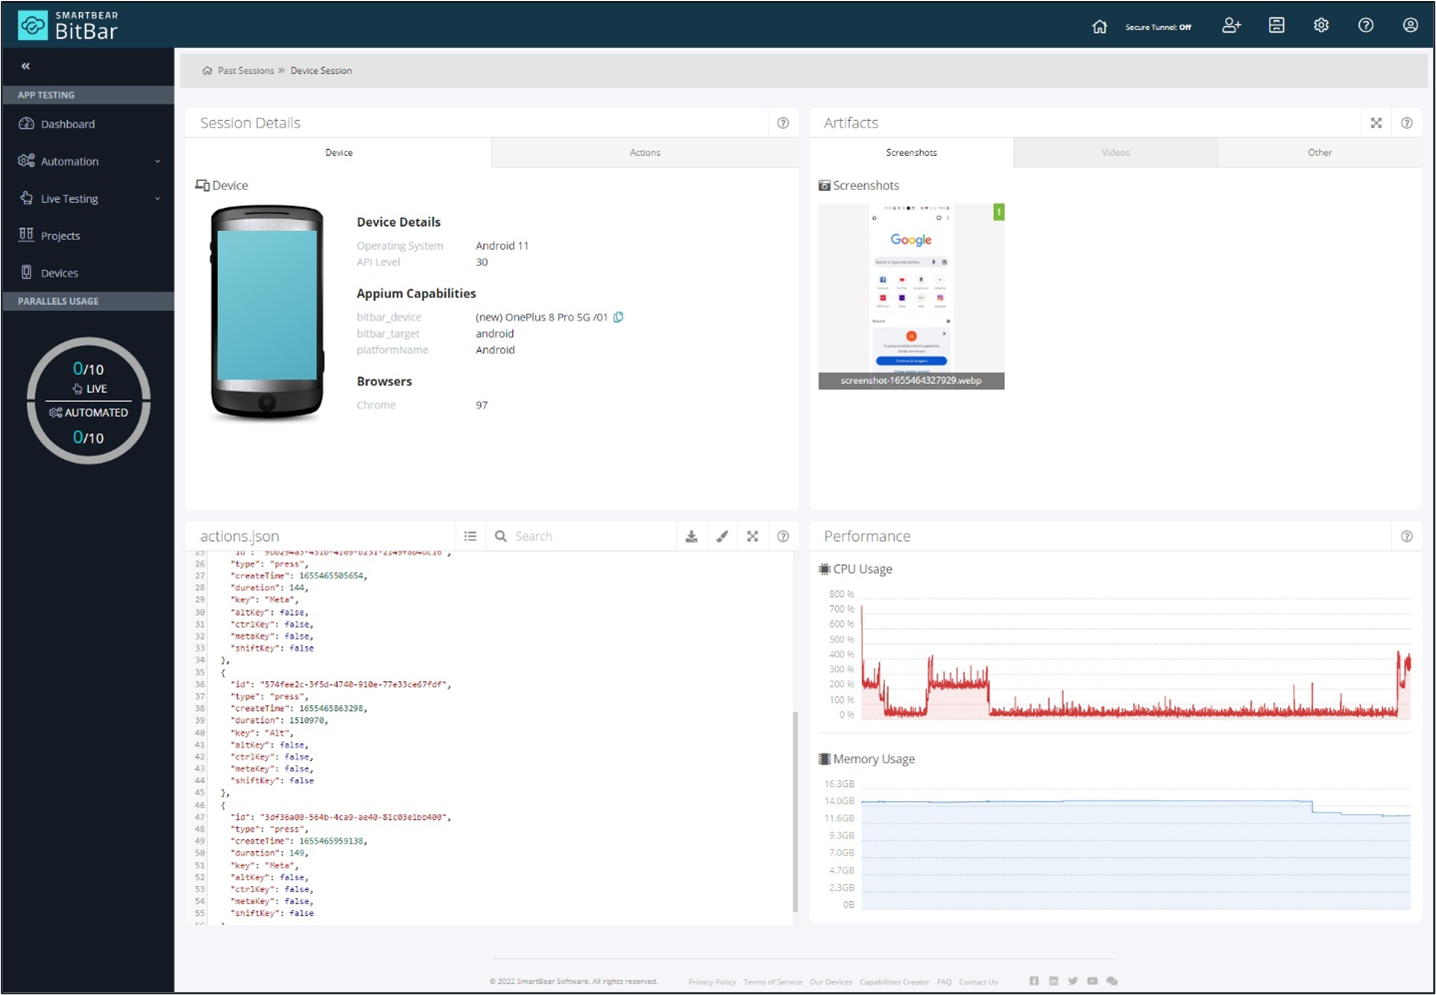
Note
You can also pause the recording by clicking the Pause actions recording.
View Test Results
After the test is completed, BitBar provides you with the test results based on the following parameters:
Session Details
Artifacts
Session Details
The Session Details widget provides detailed information related to the device details, framework capabilities, and actions that occur on a device.
The Session Details widget has the following associated attributes:
Device
Actions
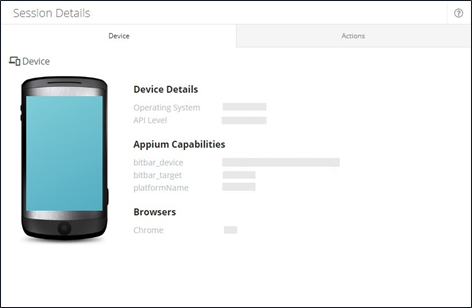
Device
The Device tab displays the information related to the device on which the test is performed.
It provides you with the following information:
Device Details
Appium Capabilities
Browsers
 |
Actions
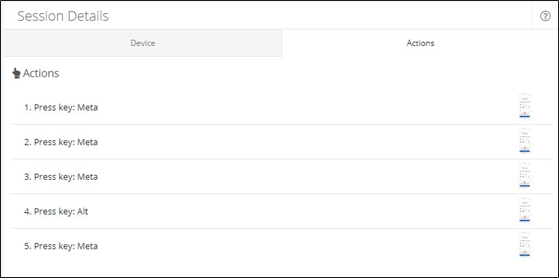
The Actions tab displays the information of live test sessions that are performed on the device.
The list of Actions varies based on the activities or tasks performed on the device.
 |
Artifacts
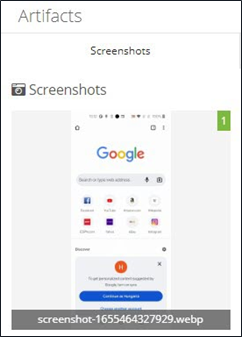
The Artifacts widget displays the screenshots, videos, and others such as device logs, performance, and actions that are captured during the selected test and allows you to view and analyze them. They are displayed in the order of capturing. The artifact files are downloadable.
 |
 |
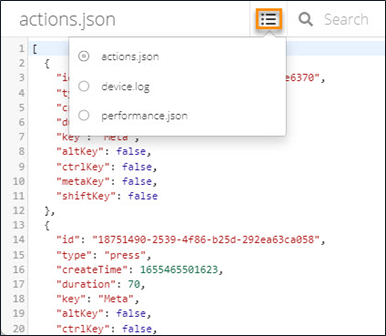
To display the Other artifacts, click to select the available log files from the drop-down list.
View Past Sessions
Perform the following steps to view past sessions and corresponding details:
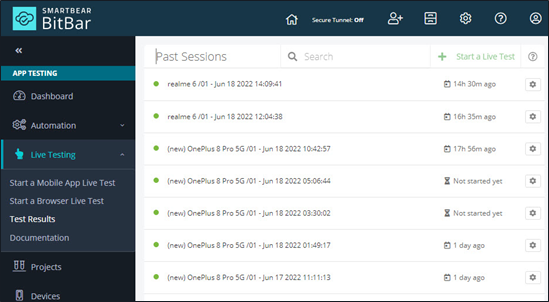
On the BitBar dashboard, click Live Testing and select Test Results.
The Past Sessions page is displayed with the list of the previous live test runs.
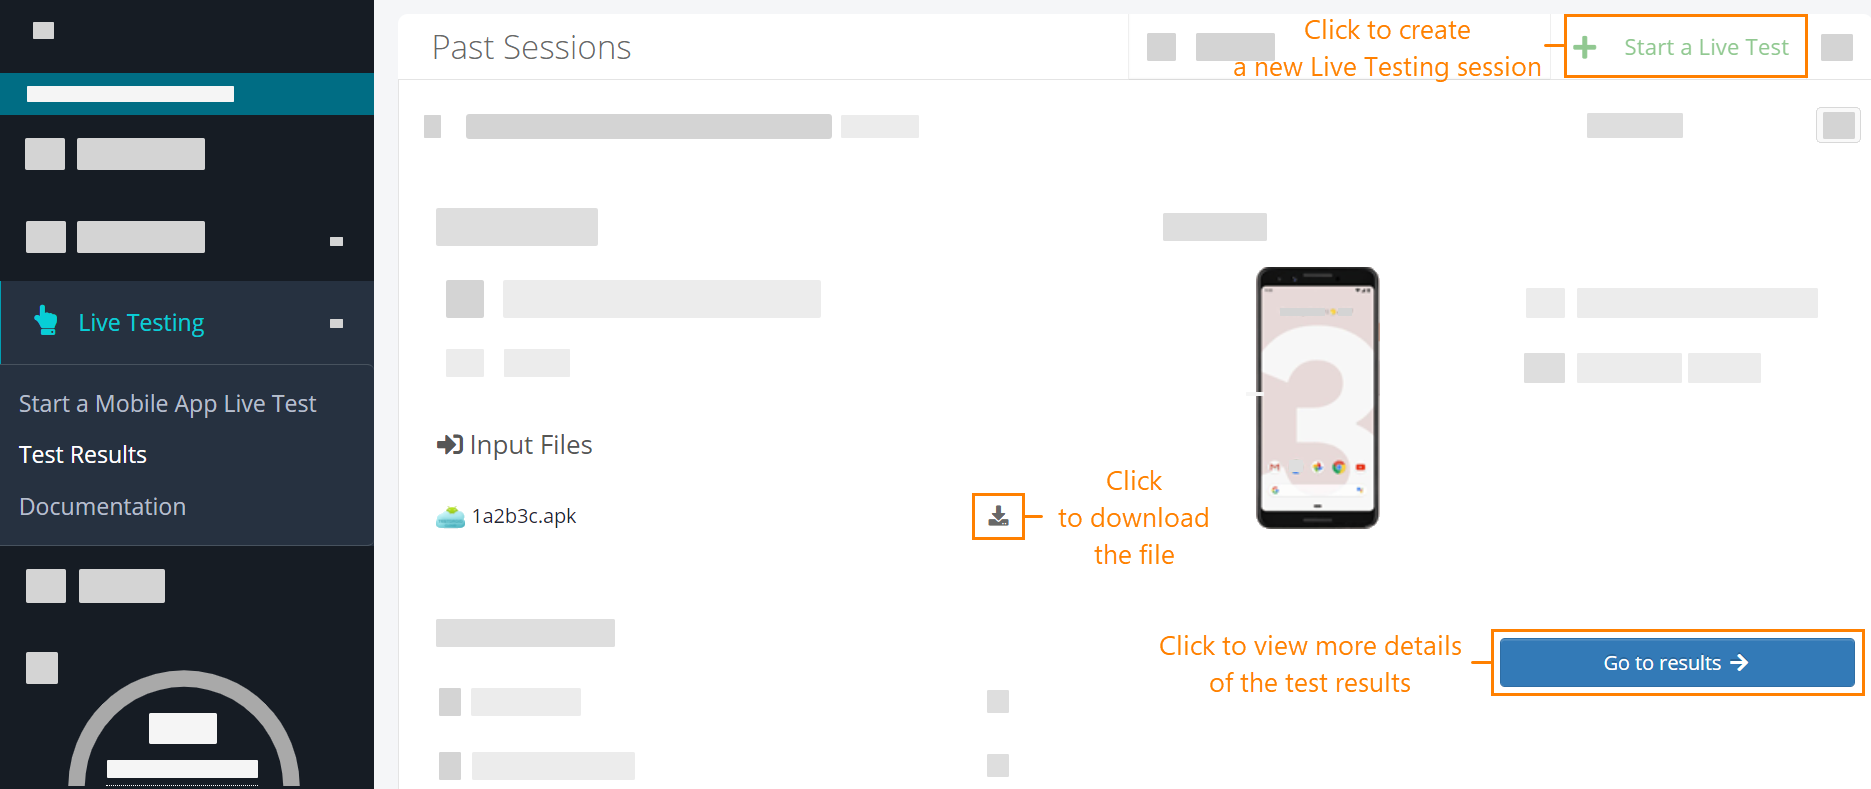
Select a specific test and click Go to results to view the detailed result of the test.
Performance
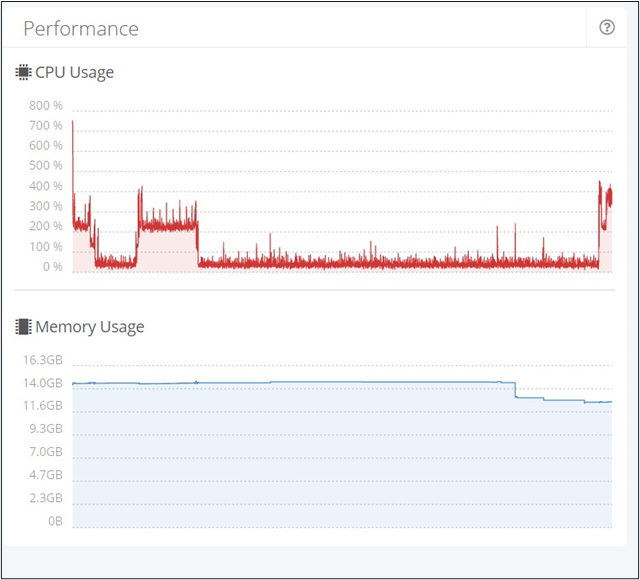
The performance widget allows you to view and analyze the performance of the test on the selected device or the browser.
Performance widget has the following associated attributes:
CPU Usage
Memory Usage
CPU Usage
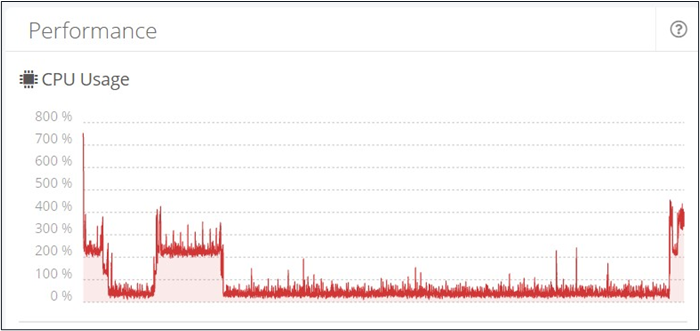
CPU Usage provides information on the percentage of time that the device CPU is being used to complete the test. The CPU usage varies based on the complexities of the test that is running.
 |
Memory Usage
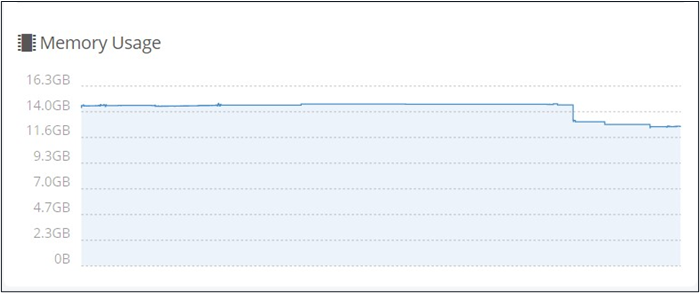
The Memory Usage attribute allows you to view the amount of memory available on your testing device, as well as the memory currently in use for the test run on the device.
 |