Test Results
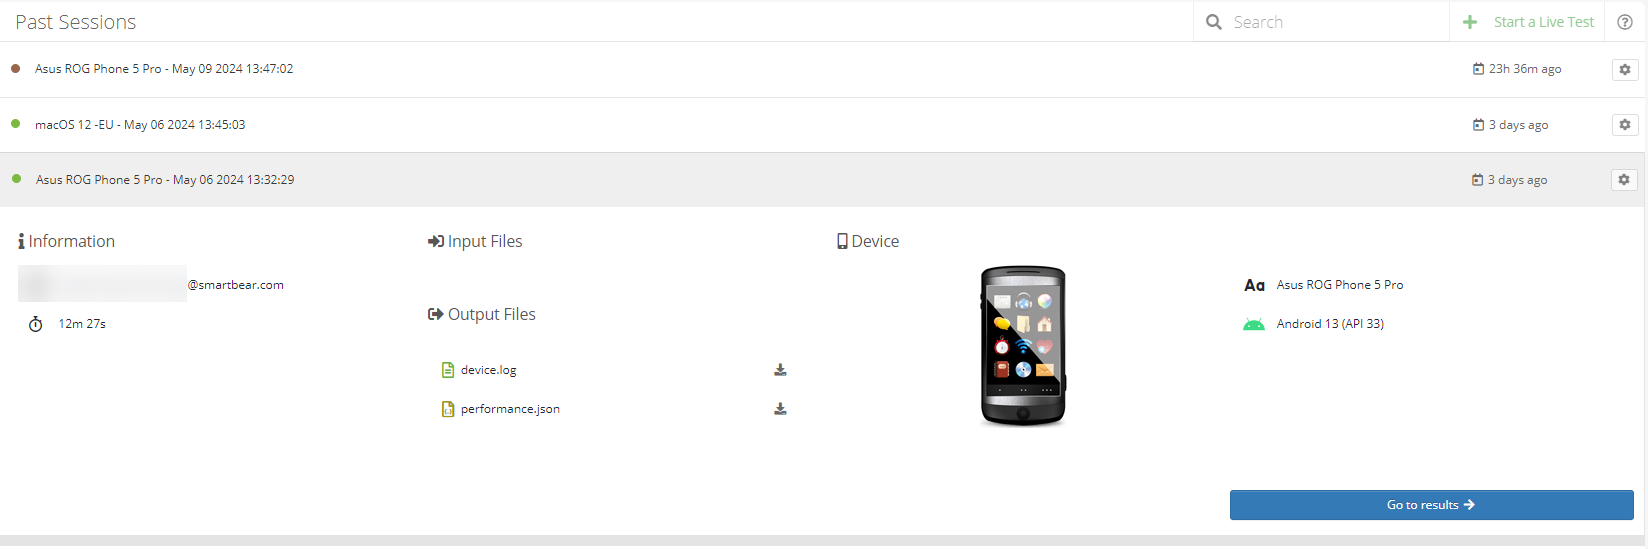
The Test Results page holds records of your past live testing sessions. To access it, navigate to Live Testing > Test Results. On this page, you can view a list of your past live testing sessions.
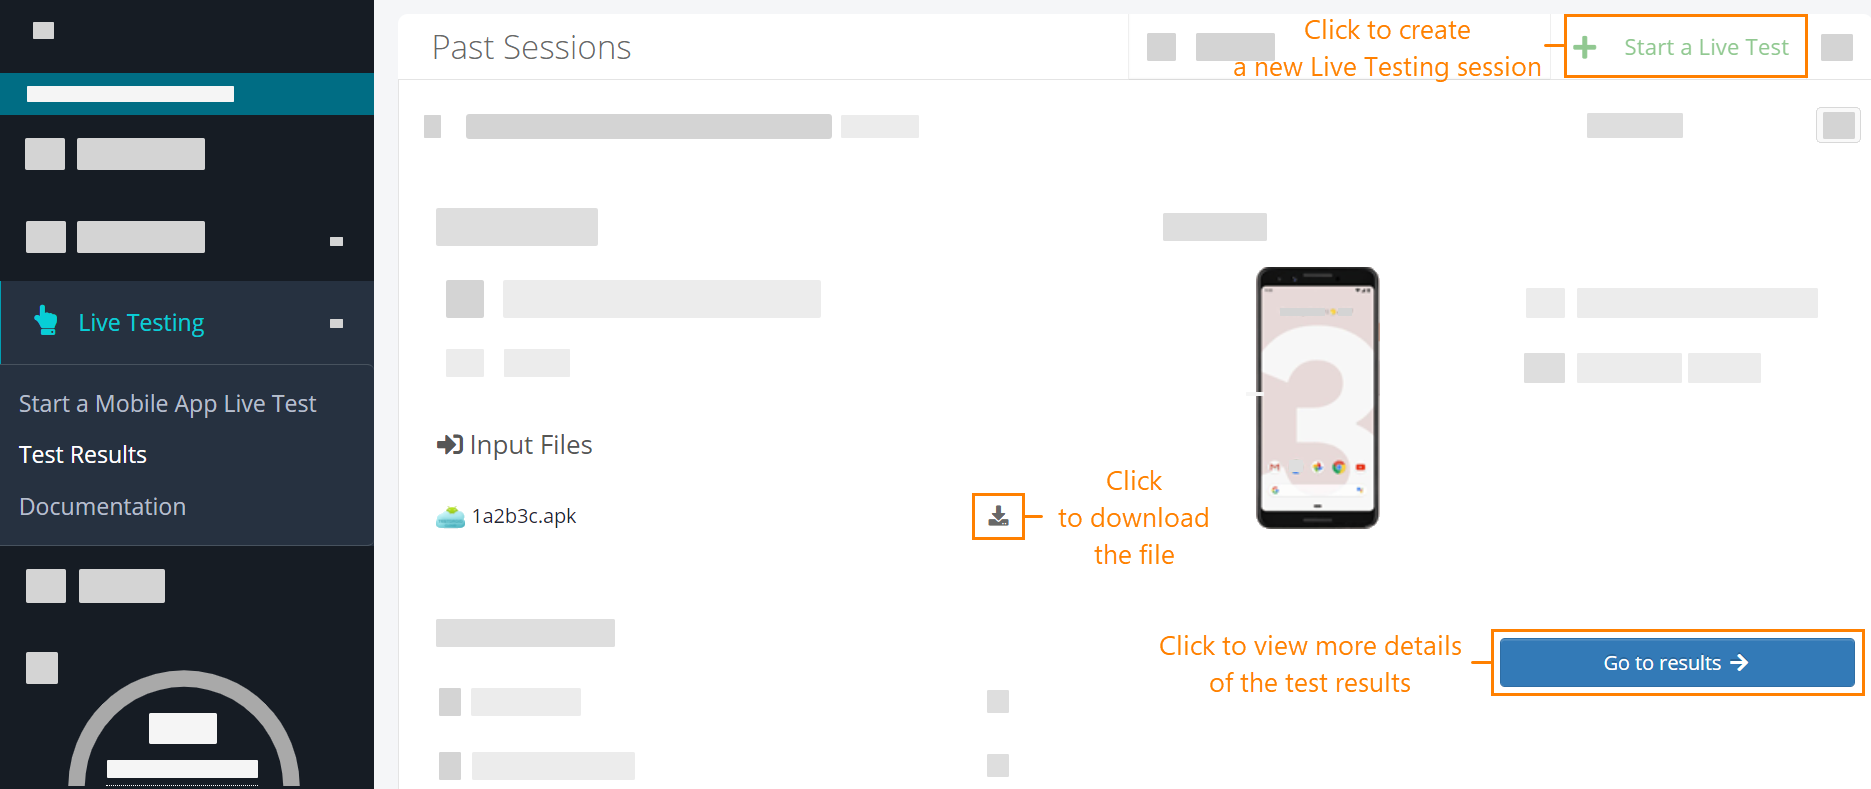 |
Clicking on any session allows you to view essential details such as start and end times, session creator, operating system used, input/output files, and device information. For additional details about the device session, click Go to results.
 |
Session Details
The Session Details widget provides details about a device session:
Device info – The tab shows information about the device you used.
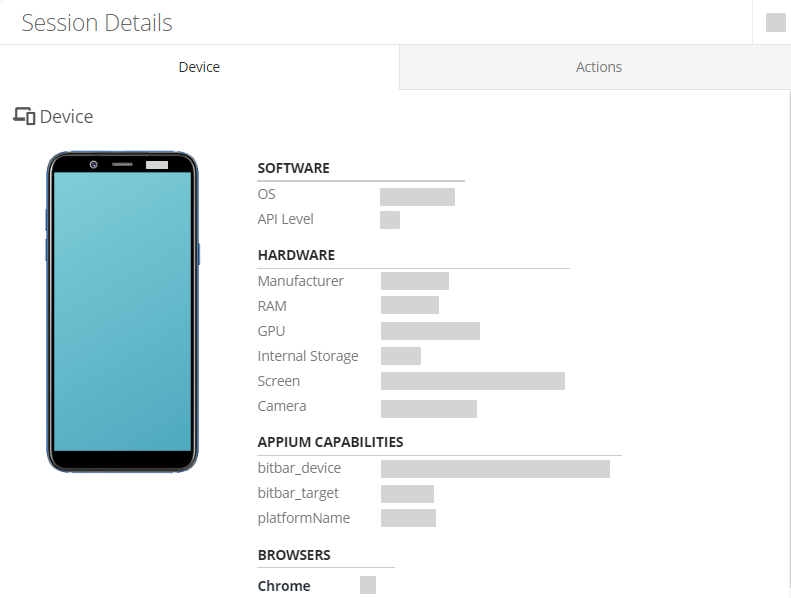
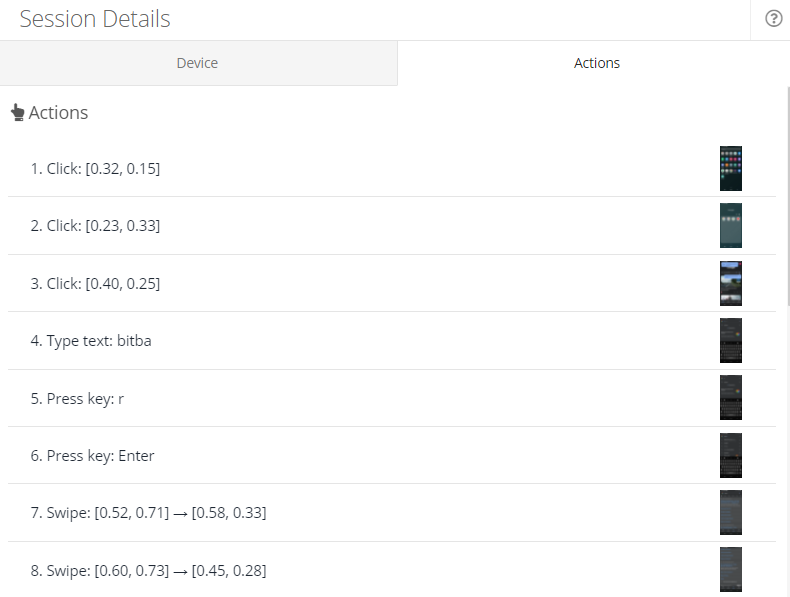
Actions – The tab shows all actions you performed over a device during a live test session.
Artifacts
The Artifacts widget shows all screenshots, videos, and device actions captured during the selected test. They are presented in the order of capturing. The artifact files are downloadable.
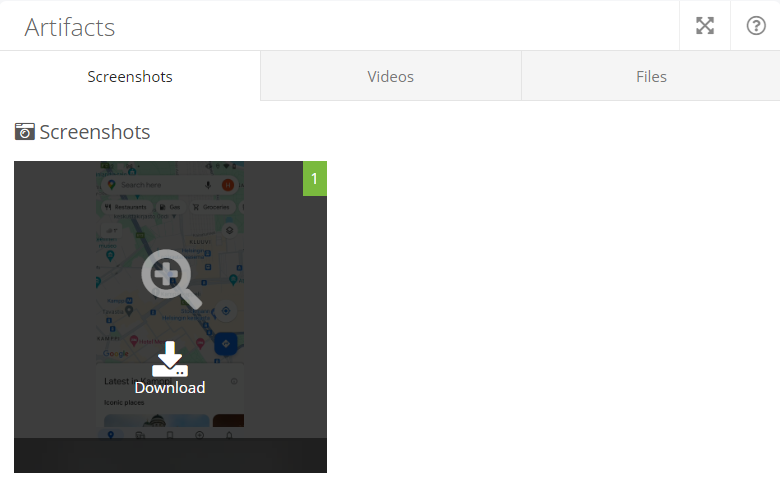
Screenshots
Navigate to the Screenshots tab to access your screenshots. Click on any screenshot to open it for viewing. You can also download the screenshot by clicking , or rotate it clicking .
Note
Your downloaded images will be in the WebP format.
 |
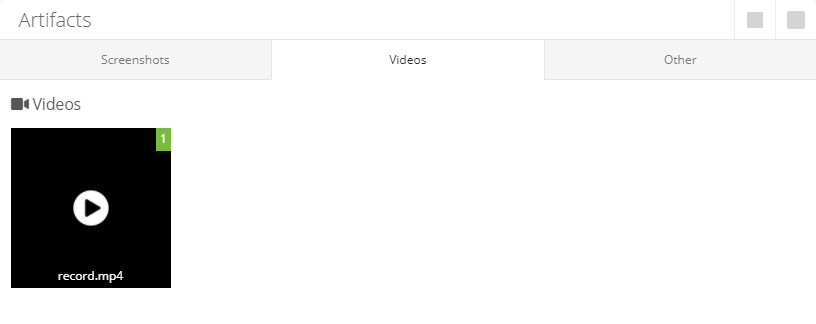
Videos
Go to the Videos tab to watch your videos. Click on a video to start watching it. You can also download the video by clicking , or rotate it clicking .
 |
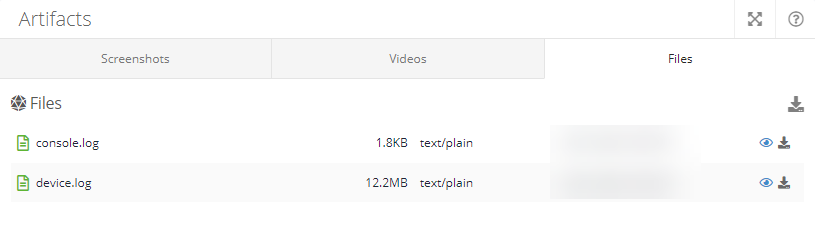
Files
The Files tab contains all generated and captured files from the test execution.
– Click it to view the file.
– Click it to download the file.
 |
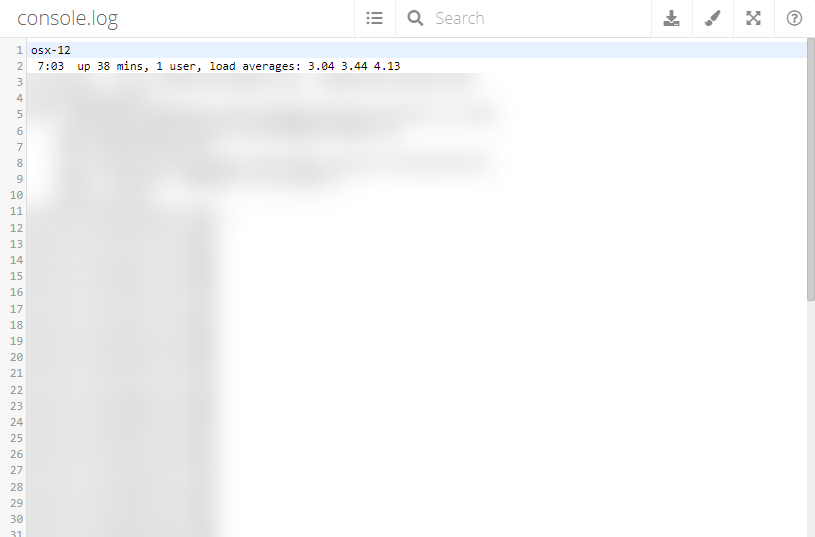
Logs
The console.log widget provides line-by-line information about the test run. It allows showing the different types of log data available from the test run. These include logcat, Appium logs. The logs can be searched by browser search or the widget’s own search box. For easier debugging the view can be enlarged to full screen.
 |
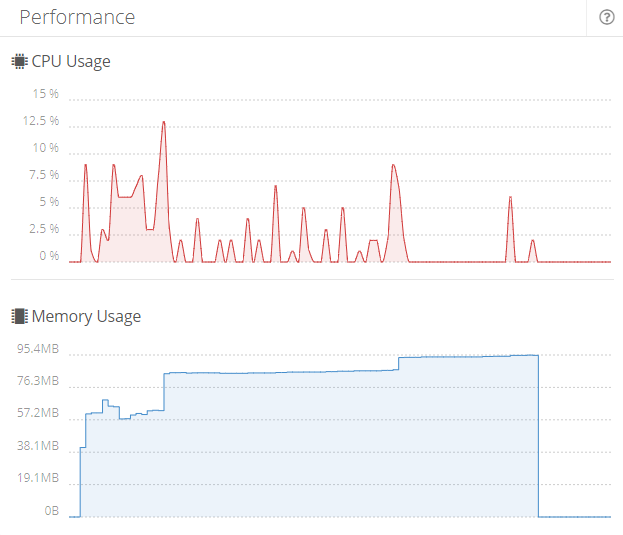
Performance
The Performance widget provides details of the test run for CPU and memory usage. You can click any given step/time to get more specific information about resource consumption.
 |