BitBar Dashboard Overview
BitBar is a versatile cloud-based platform for testing mobile and web applications. With BitBar, you can conduct live manual testing or automated testing using any of the frameworks we offer support for. BitBar accommodates testing across desktop browsers (Windows, macOS, and Linux) and real iOS and Android devices.
Once you log in, you will land on the Dashboard page.
Tip
Conveniently, you can access this page anytime from anywhere in the application using the left navigation menu.
The Dashboard page comprises three primary components:
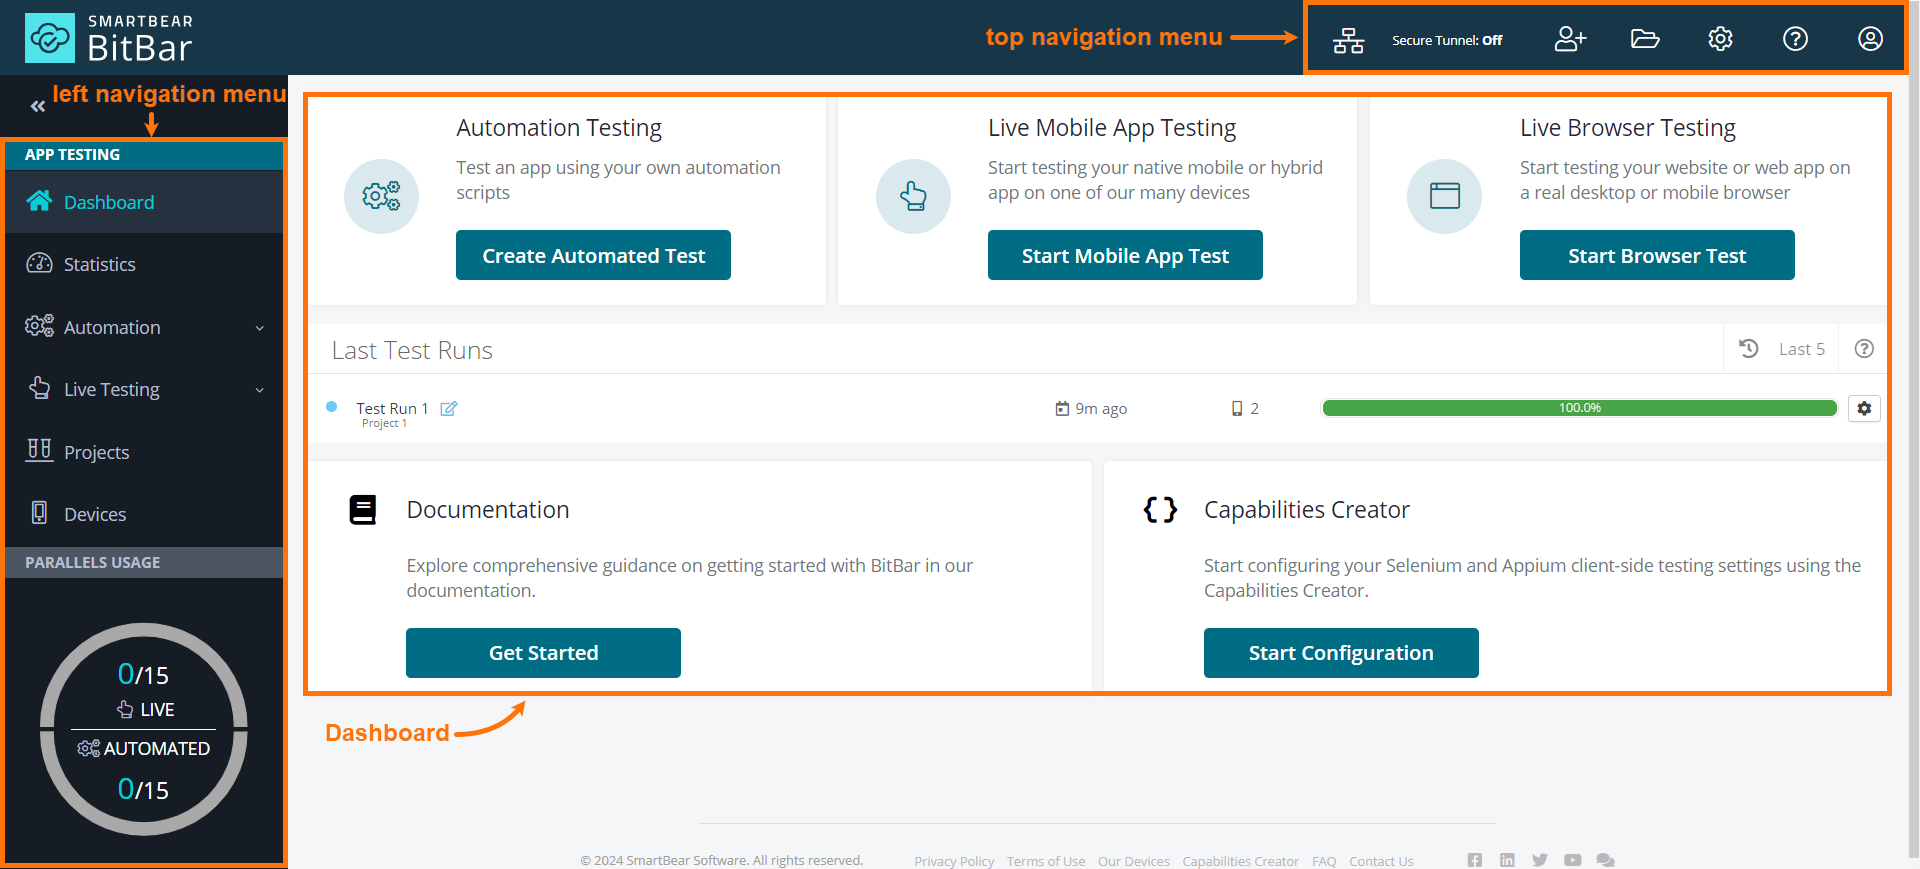 |
Top Navigation Menu
The top navigation menu provides convenient access to essential features such as customization, team management, file organization, billing details, documentation, and account review.
From the top navigation menu, you can:
Customize SecureTunnel settings.
Invite or add team members.
Organize files in your library: upload, search, and sort.
Access billing, usage details, and the security center.
Browse our documentation, access Capabilities Creator, and provide feedback.
Review your account information, subscriptions, access groups, and access the log-out option.
 |
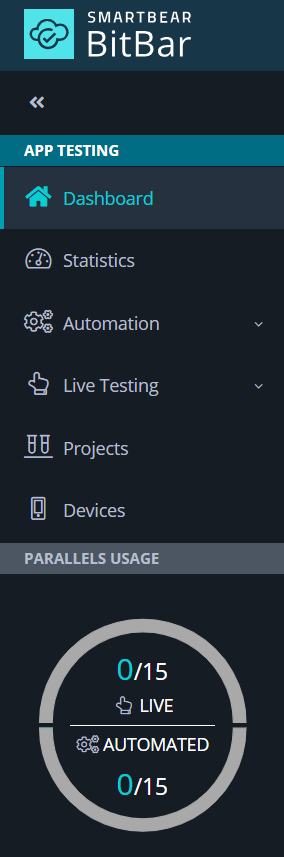
Left Navigation Menu
The left navigation menu in the BitBar application offers all the essential links for navigating and performing actions within the platform.
From the left navigation menu, you can:
Return to the Dashboard.
View the Statistics.
Create an automated test and quickly access the Capabilities Creator.
Start a mobile app and browser live test, access test results, and explore our documentation.
View your Projects.
Browse all available Devices.
View the amount of parallels currently in use by your account with our easy-to-read gauge.
 |
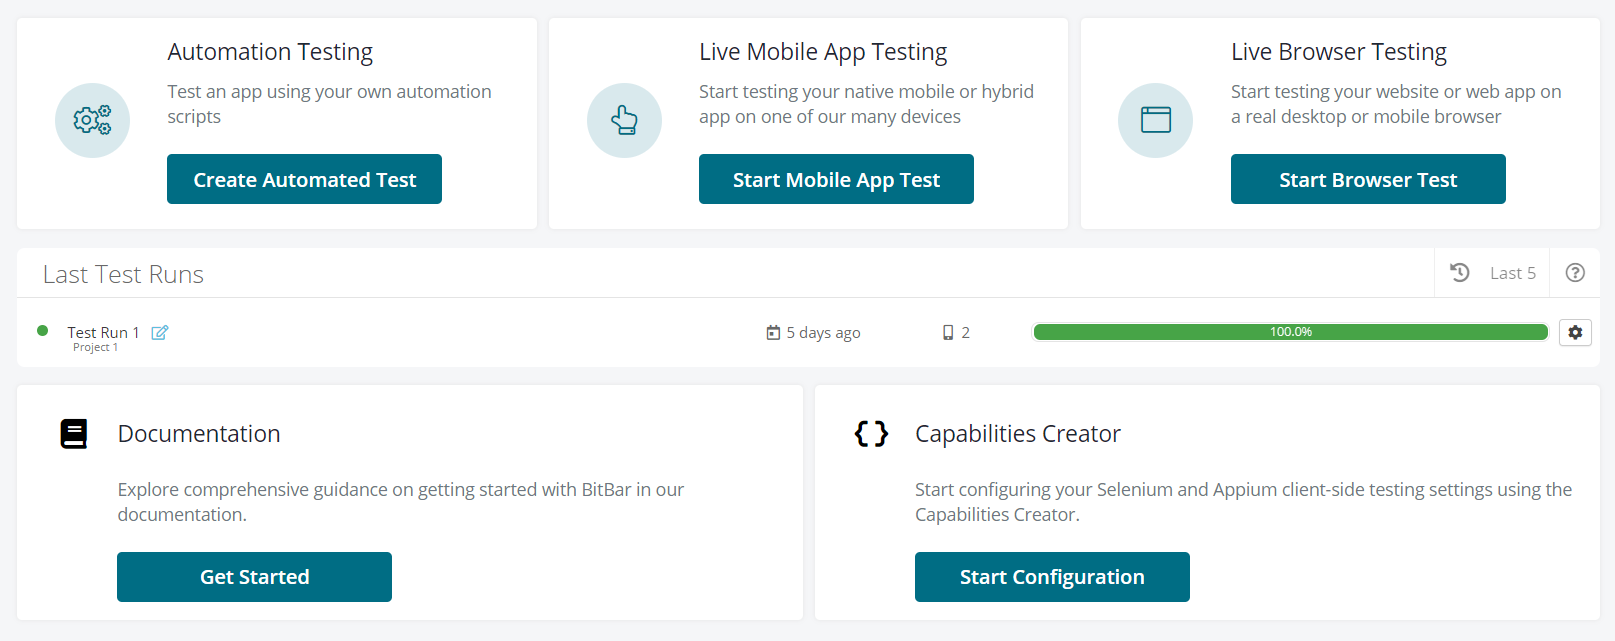
Dashboard
The Dashboard is your command center for all testing activities.
From the Dashboard, you can:
Create an automated test.
Start testing your native mobile or hybrid app on one of our many devices.
Start testing your website or web app on a real desktop or mobile browser.
View your last test runs.
Explore our documentation on getting started with BitBar.
Start configuring your Selenium and Appium client-side testing settings using the Capabilities Creator.
 |