Statistics
Easily access your account's usage statistics, test run data, and device usage information on the Statistics page. From the left navigation menu, click Statistics to gain valuable insights into your account's usage patterns. This data helps you make informed decisions and optimize your experience effectively.
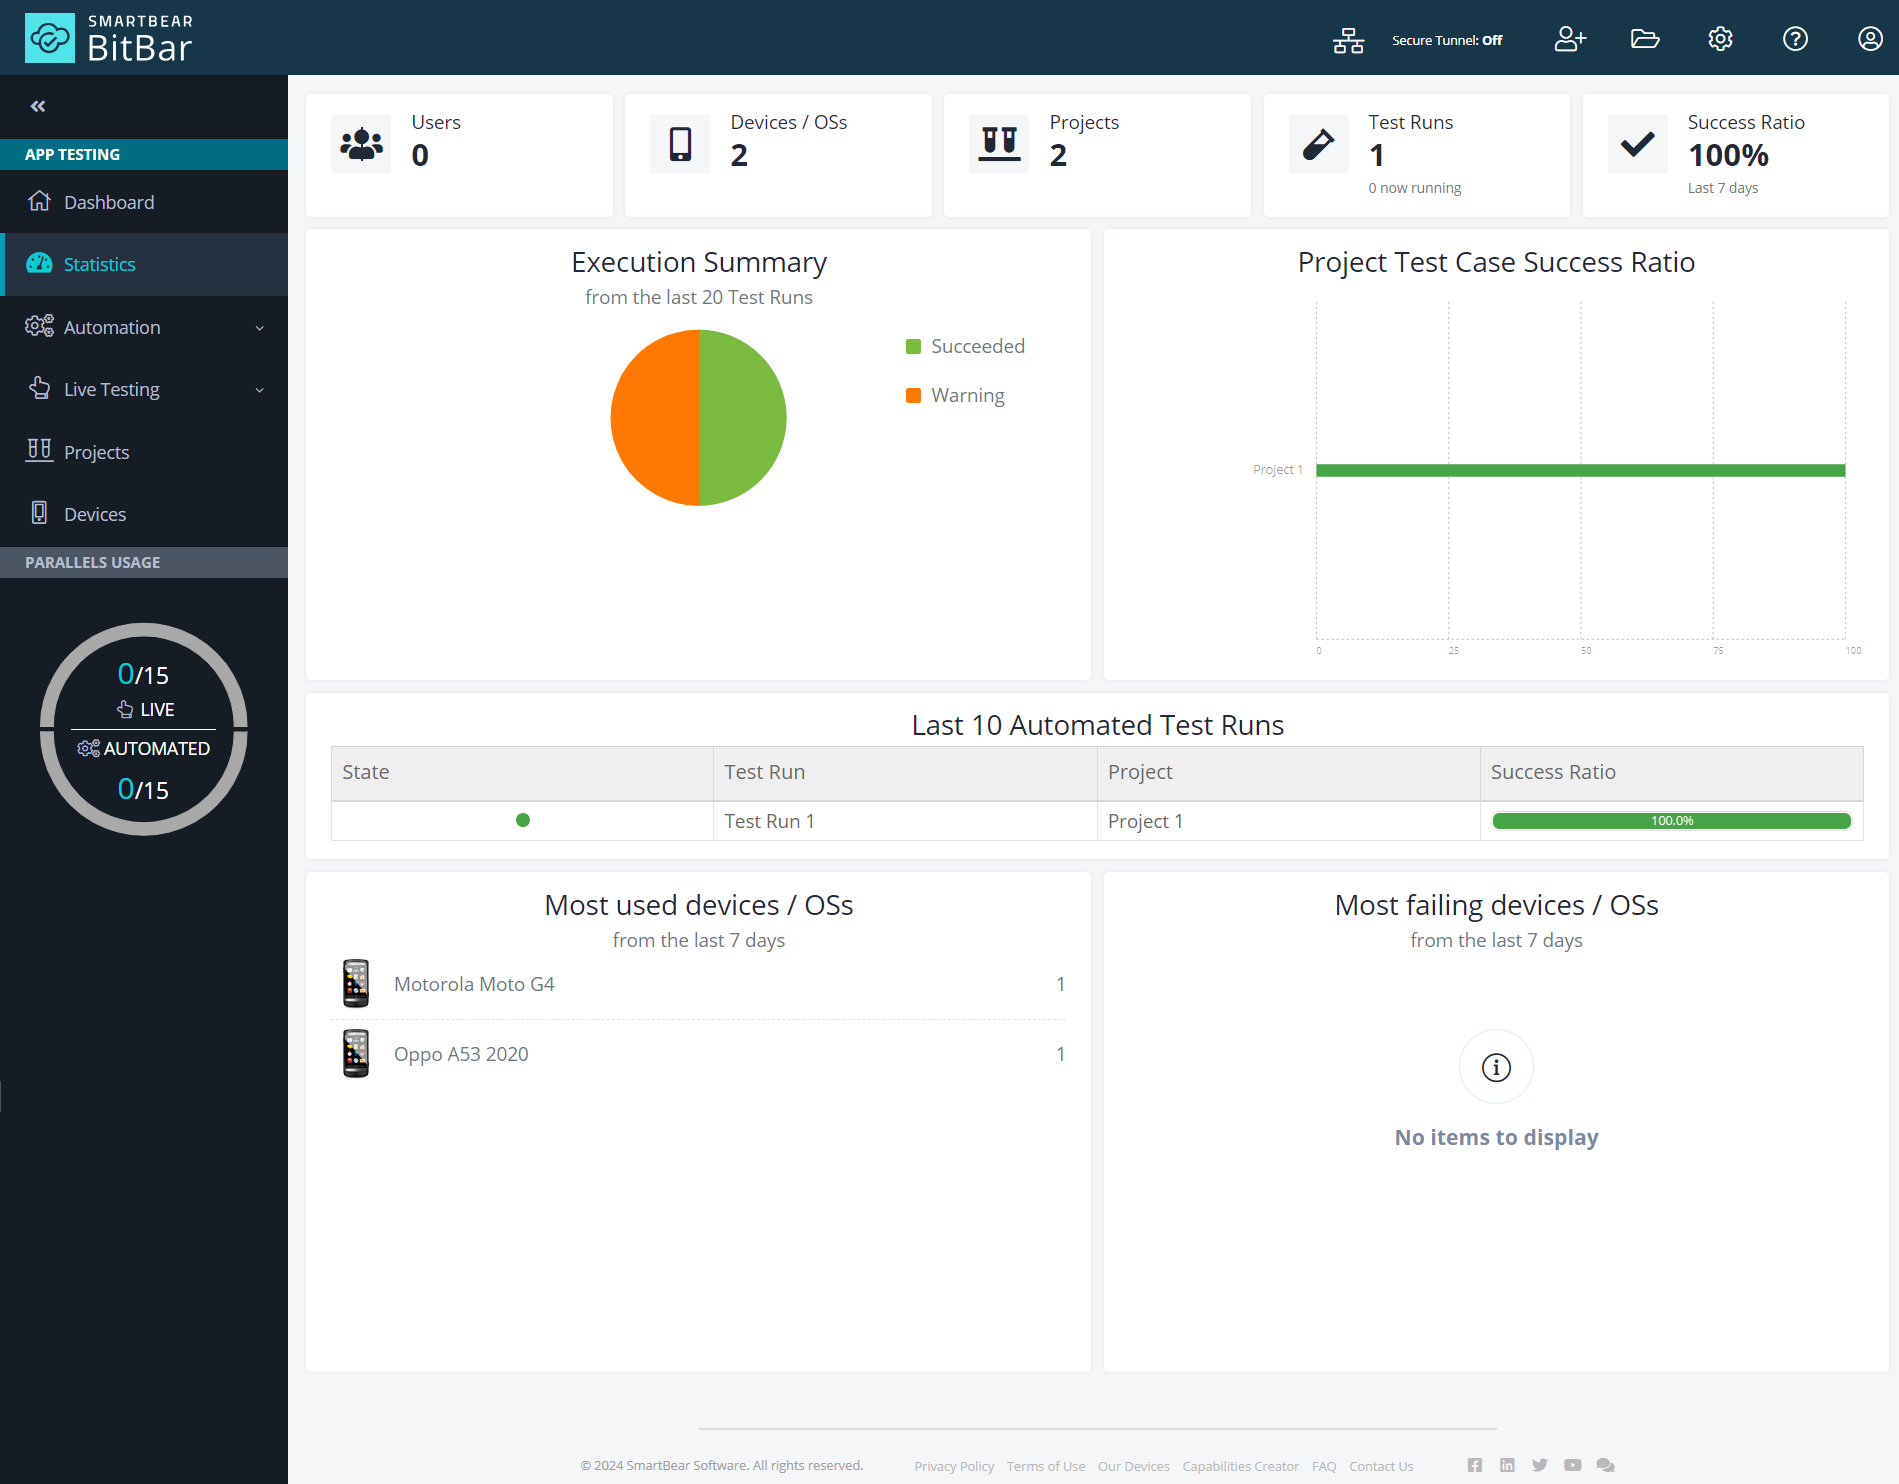 |
Delve into the detailed metrics (described in the Statistics Overview: Insights and Access Details table), offering you a transparent view of your account usage. Covering user counts, device performance, and test execution ratios, this concise overview equips you to enhance your testing processes with precision.
Section | Information | Access |
|---|---|---|
Users | The total number of users associated with the account. The main account user is considered as the first or the primary user and any additional users are added to that. | Main account user Sub-account users |
Devices/OSs | Number of devices used in projects. This includes devices used by the main account user and sub-account users attached to the main account. | Main account user Sub-account users can only view devices used exclusively by them. |
Projects | The total number of projects created for which the test runs are performed by the main account user and the sub-account users during the past month. | Main account user Sub-account users can only view their own projects. |
Test Runs | Total number of test runs performed. | Main account user Sub-account users can only view their own test runs. |
Success Ratio | Cumulative test-case pass ratio from all the test runs done by the main account user and sub-account users for the past month. | Main account user Sub-account users can only view their own pass ratio. |
Execution Summary (from the last 20 Test Runs) | Information on device performance during test runs. Some devices may be excluded from the run depending on the test case. For example, because their API level is too old, or a processor is too slow. | Main account user Sub-account users |
Project Test Case Success Ratio | The overall quality of test executions per project. Success ratio includes sub-account user test runs. | Main account user Sub-account users can only view the test runs from their own projects. |
Last 10 Automated Test Runs | Success execution ratios of last 10 test runs. Highlights potential issues with test quality or device performance. | Main account user Sub-account users |
Most used devices/OSs (from the last 7 days) | Most frequently utilized devices/OSs. | Main account user Sub-account users |
Most failing devices/OSs (from the last 7 days) | Devices/OSs with the highest failure rates. | Main account user Sub-account users |