Analyzing Results
BitBar offers comprehensive test run results and device performance data. You can easily access and analyze these results in one of the following ways:
For a quick overview, visit the test run summary.
For a detailed analysis, navigate to the test run details.
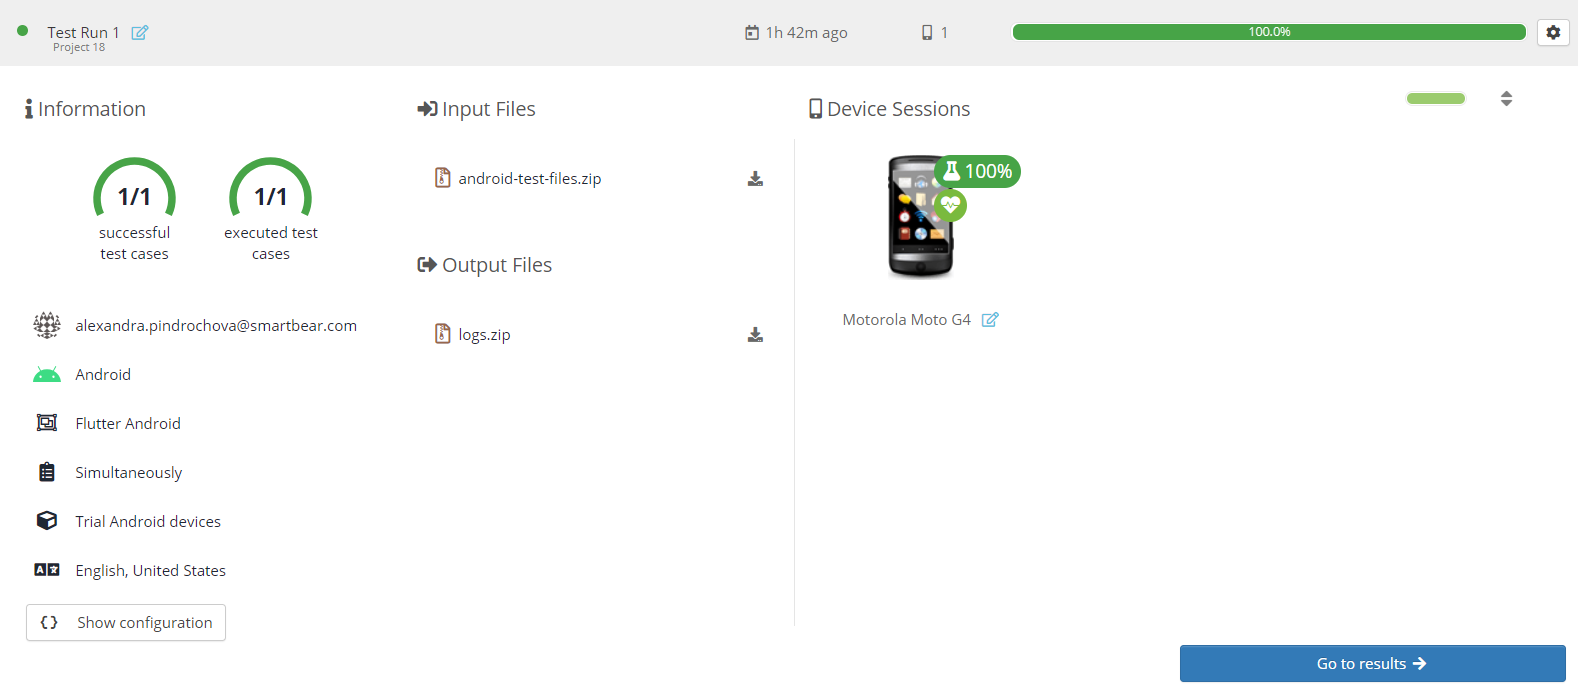
Test run summary
You can view the test run summary in two ways:
From the Dashboard, navigate to the Last Test Runs section.
In the Projects tab, expand a project and select any test run.
 |
Test run details
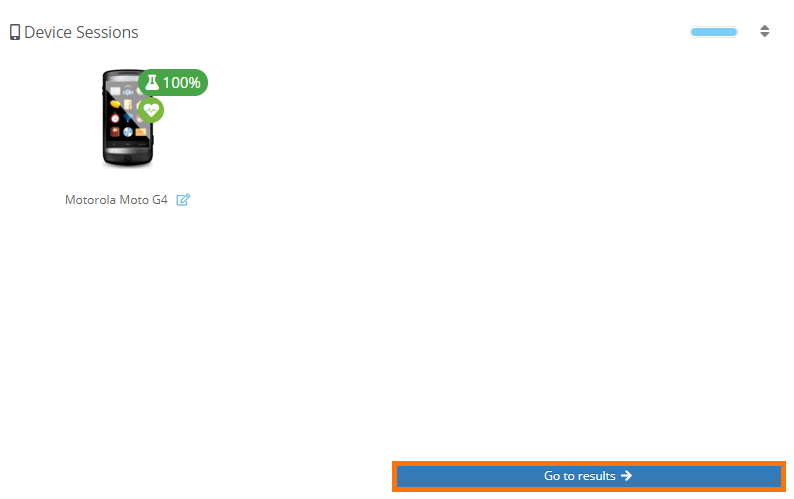
For additional details on the test run and to compare results across devices, click Go to results located at the bottom of the test run summary.
 |
The test run details view includes five sections:
Artifacts
Performance
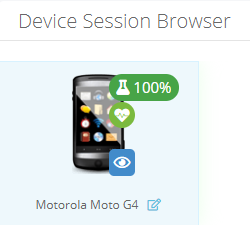
Device Session Browser
The Device Session Browser widget displays the devices used in the test run.
Each device's current state is indicated by the color-coded icon:
Yellow for Waiting
Blue for Running
Green for Succeeded
Orange for Warning
Brown for Aborted
Red for Failed
The icon indicates the success rate of the test method for each device. Hover over the icons for more details.
Hovering over a device reveals an icon. Click on this icon to view details for that specific device.
To edit a device's name, click the icon.
 |
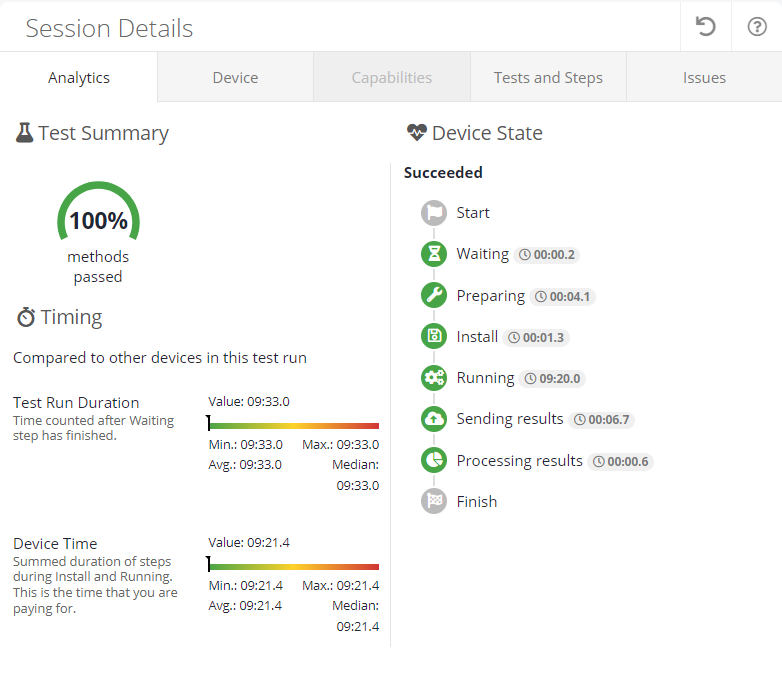
Session Details
Note
You can retry the device session by clicking the icon.
The Session Details widget is organized into the following tabs for easy navigation:
Analytics
The Analytics tab provides details about the Test Summary and Device State.
 |
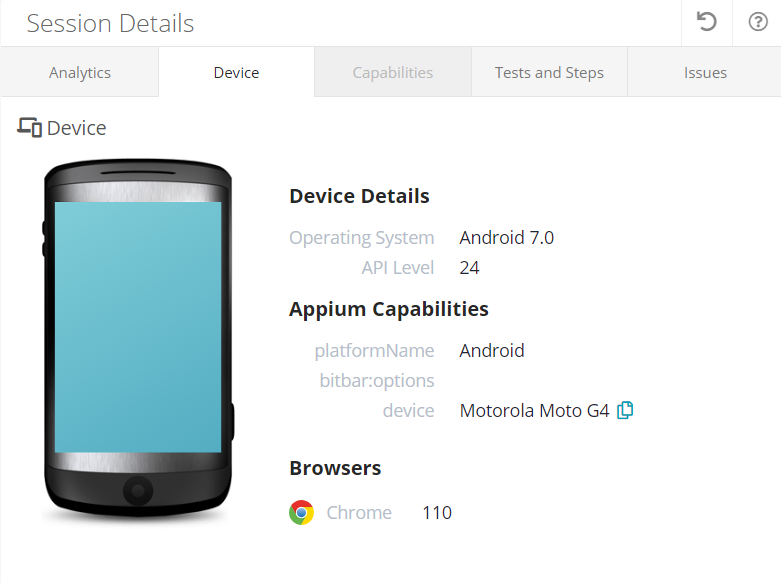
Device
The Device tab contains information about device details, capabilities, and browsers.
 |
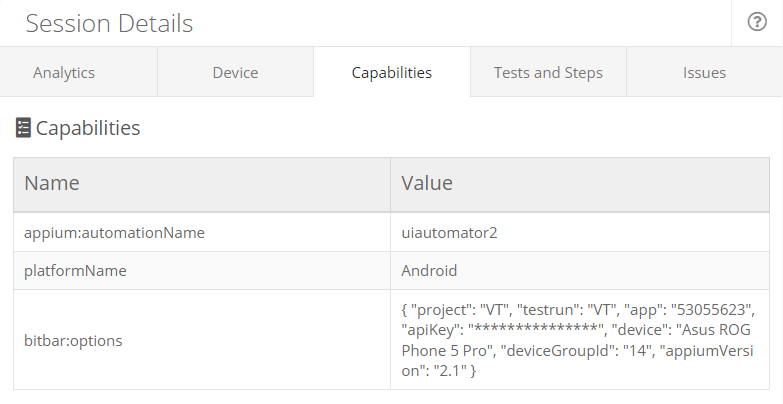
Capabilities
The Capabilities tab exclusively showcases custom capabilities utilized by users for running client-side tests, specifically Selenium and Appium.
 |
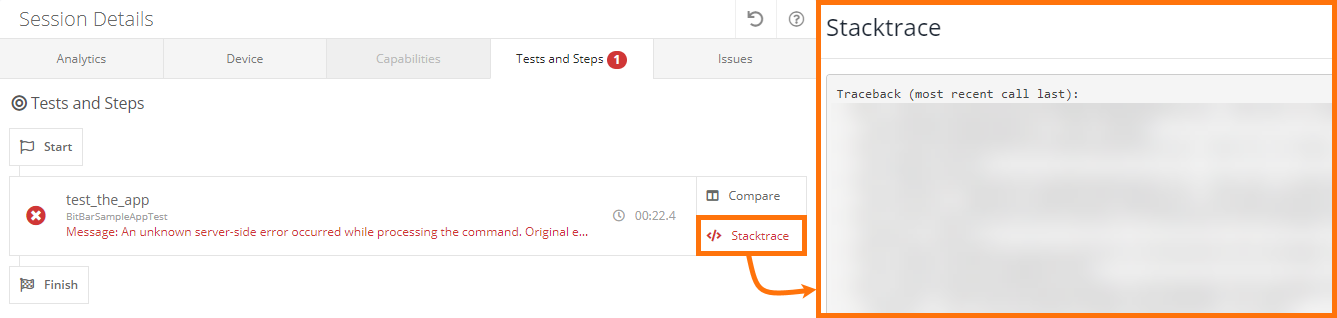
Tests and Steps
If your test includes test steps or functions, they are displayed in the order they were executed. The Tests and Steps tab indicates the sequence of test execution and whether the functions were successful or not.
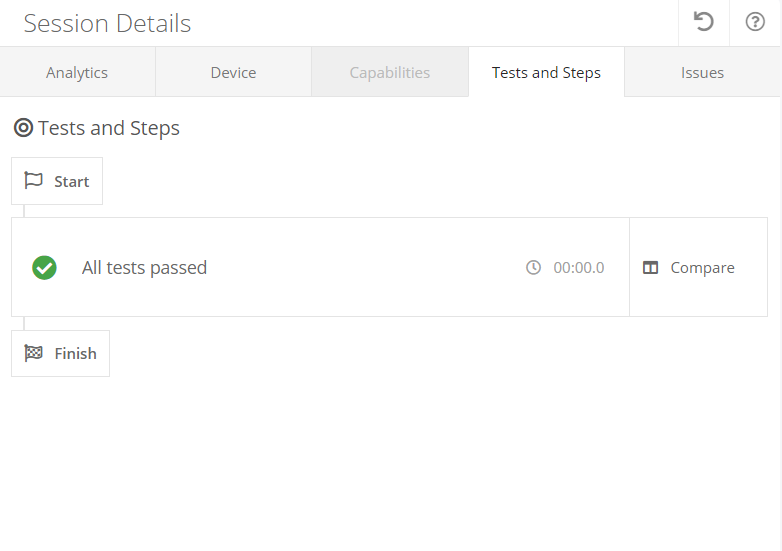 |
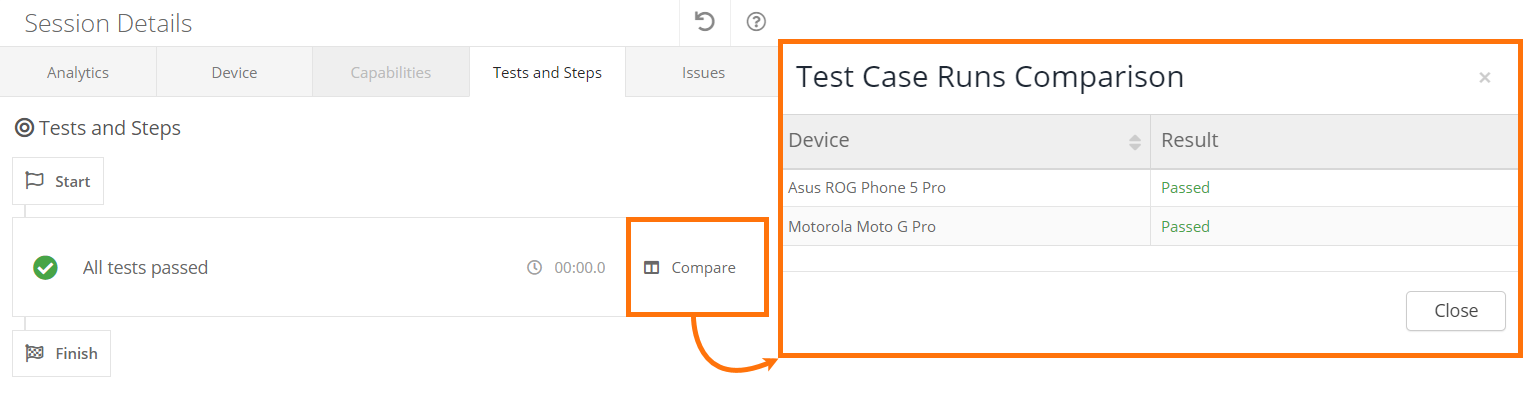
Also, you can compare the test case runs among the devices used in the test run.
 |
In case of a test run error, you can access the stack trace by clicking Stacktrace, allowing for swift identification of the issue's source.
 |
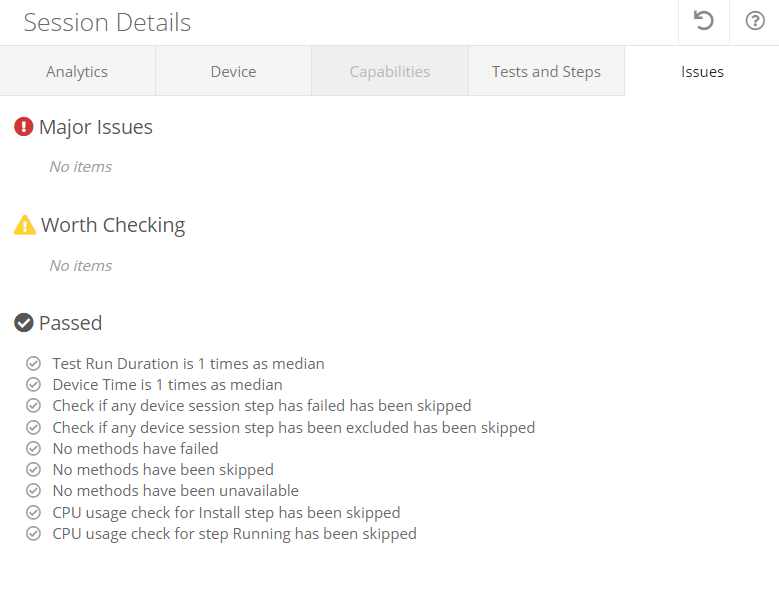
Issues
On the Issues tab, you can find execution issues, issues that might be worth checking, and the test run status.
 |
Artifacts
The Artifacts widget is organized into the following tabs for easy navigation:
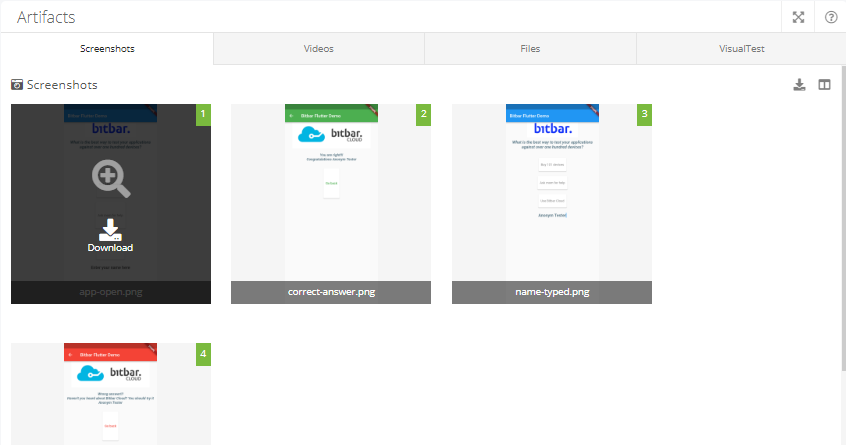
Screenshots
Navigate to the Screenshots tab to access your screenshots. Click on any screenshot to open it for viewing. You can also download the screenshot by clicking , or rotate it clicking .
 |
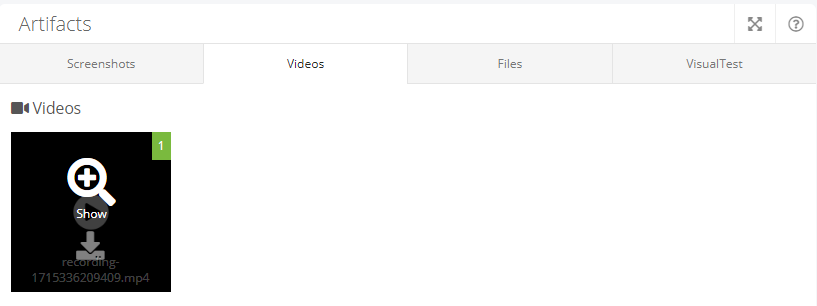
Videos
Go to the Videos tab to watch your videos. Click on a video to start watching it. You can also download the video by clicking , or rotate it clicking .
 |
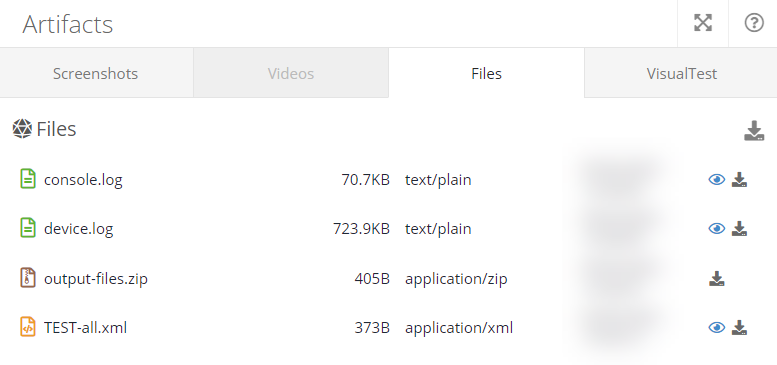
Files
The Files tab includes all files generated and captured during the test. You can manage which files are saved and displayed here by configuring your run-tests.sh.
– Click to view the file.
– Click to download the file.
– Click to open the file in a new tab.
 |
VisualTest
For details on how BitBar integrates with VisualTest, consult VisualTest.
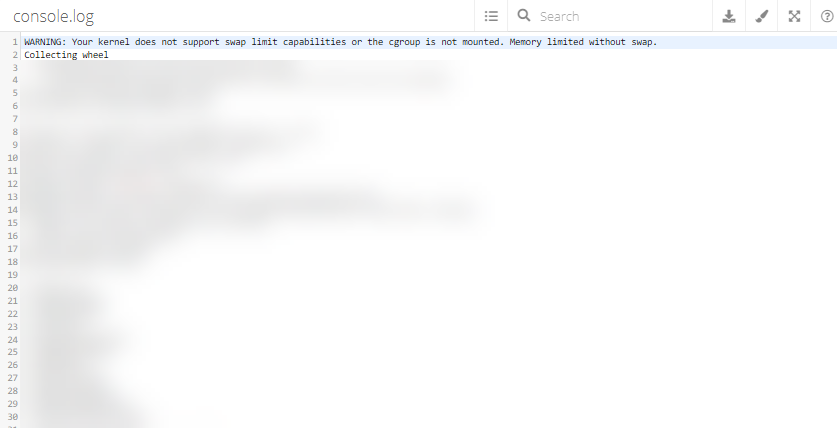
Logs
The console.log widget provides line-by-line information about the test run. It allows showing the different types of log data available from the test run. These include logcat, Appium logs. The logs can be searched by browser search or the widget’s own search box. For easier debugging the view can be enlarged to full screen.
 |
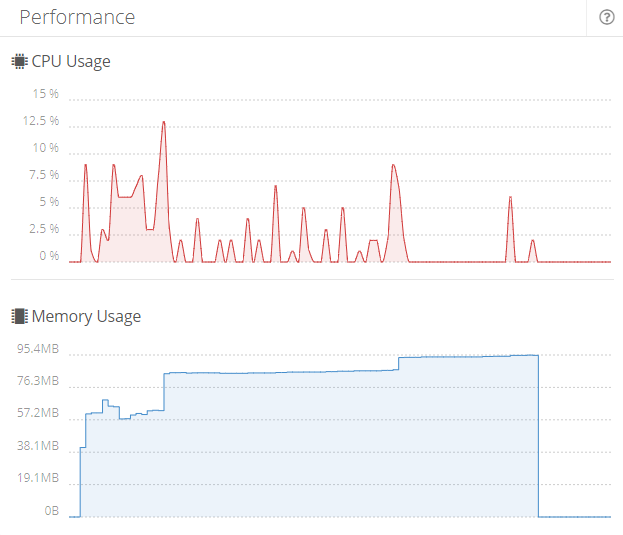
Performance
The Performance widget provides details of the test run for CPU and memory usage. You can click any given step/time to get more specific information about resource consumption.
 |