Test Metrics (Gadgets)
Testing specific metrics can be viewed via a variety of gadgets that are found in the Gadget Directory. Since Zephyr Squad uses a standard Jira issue-type, many out-of-the-box gadgets can be used. The following testing-specific gadgets are available:
 Test Execution Time Tracking by Cycle
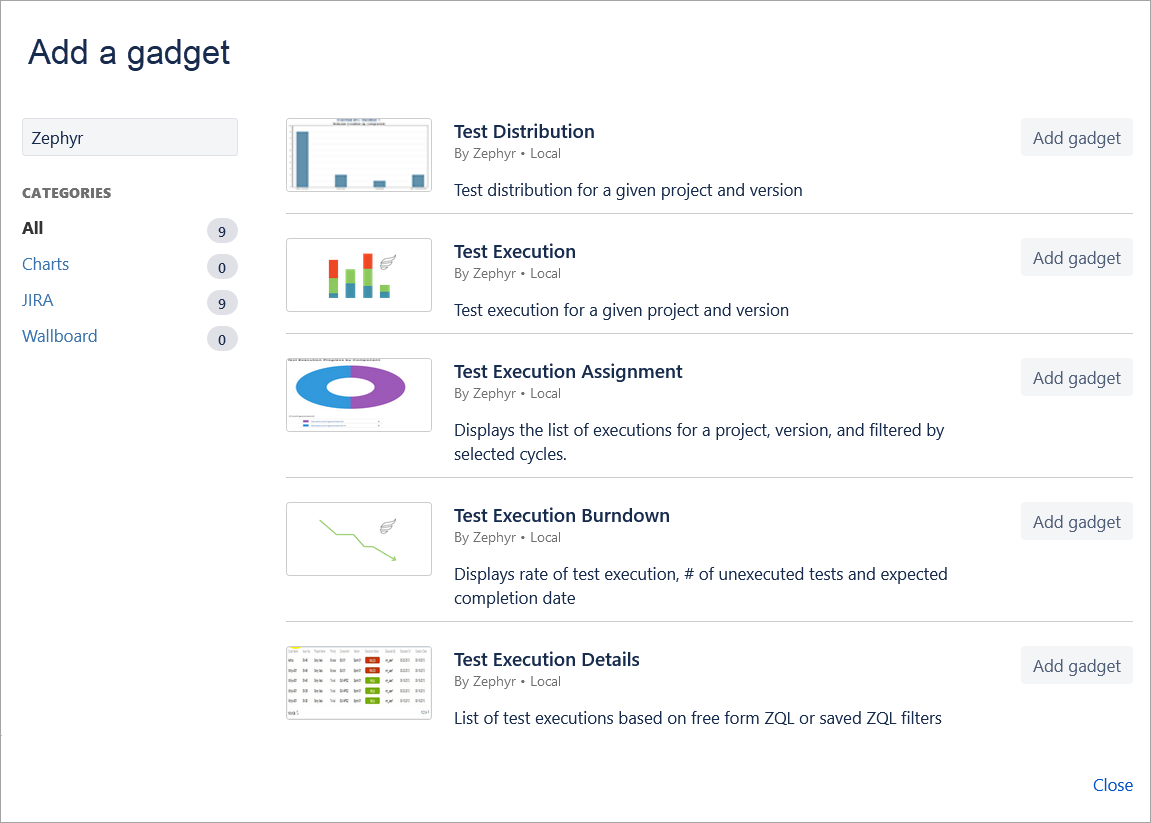
Open a dashboard, click Add Gadget and search for "Zephyr" or click Other in the list on the left to find all the testing related gadgets. Once added to a dashboard, they can be customized to provide detailed test metrics for any project and version.
 |
Test Distribution
The Test Distribution gadget displays totals of tests that have been created for a particular project-version combination. The version here is the Fixed Version.
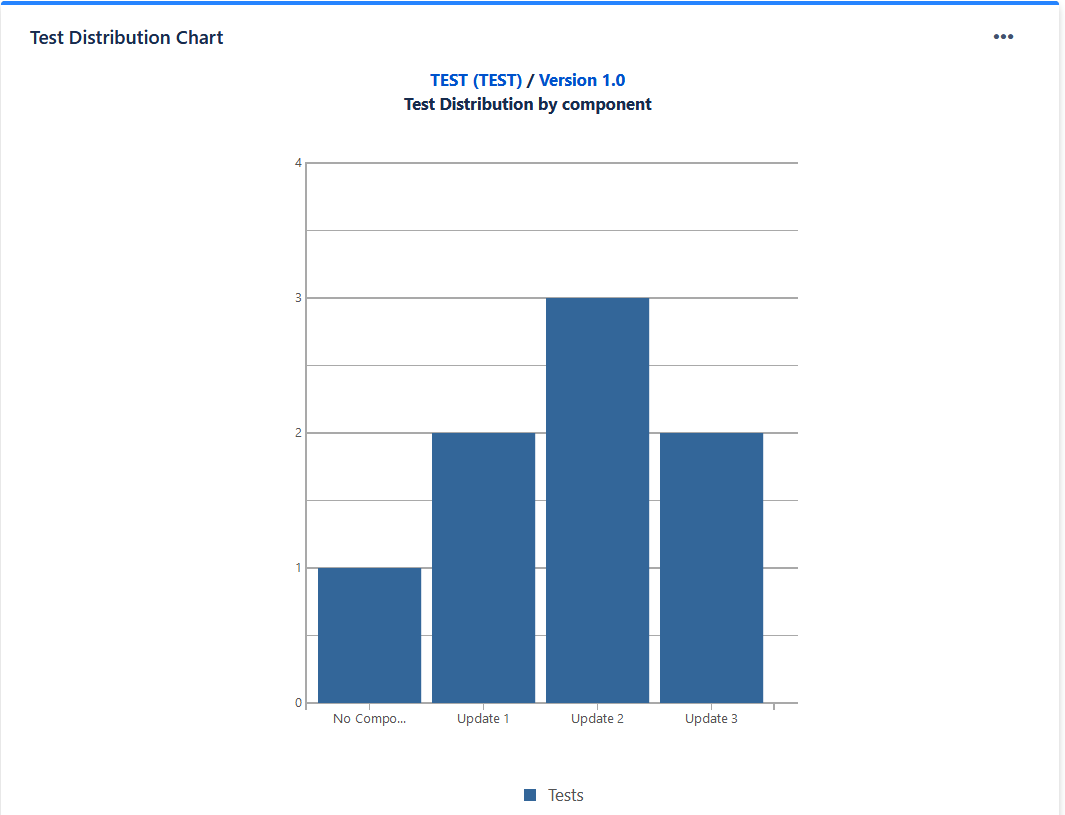 |
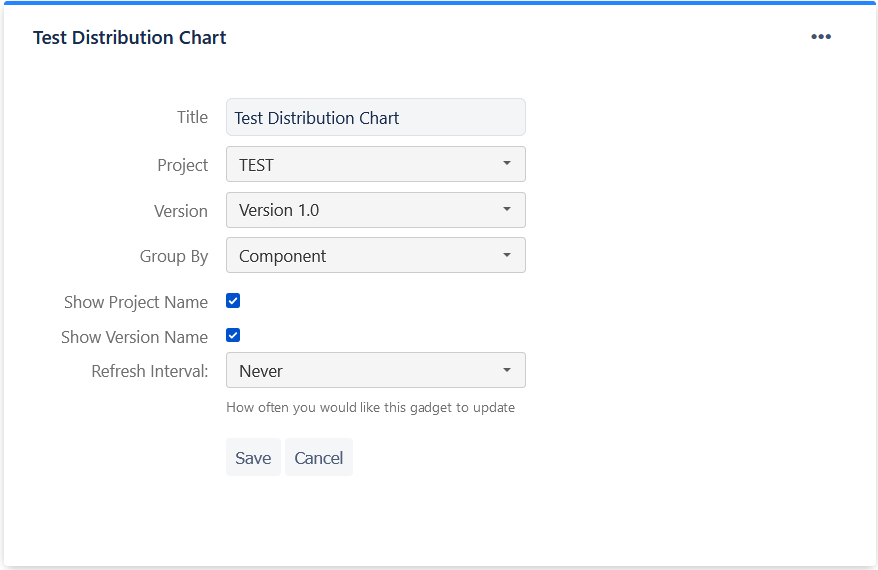
Click the ellipsis button in the top-right corner, and then click Edit to customize the gadget. The Title, Project and Version can be changed. Test Distribution data can be grouped either by Component or User. The Refresh Interval can also be modified.
 |
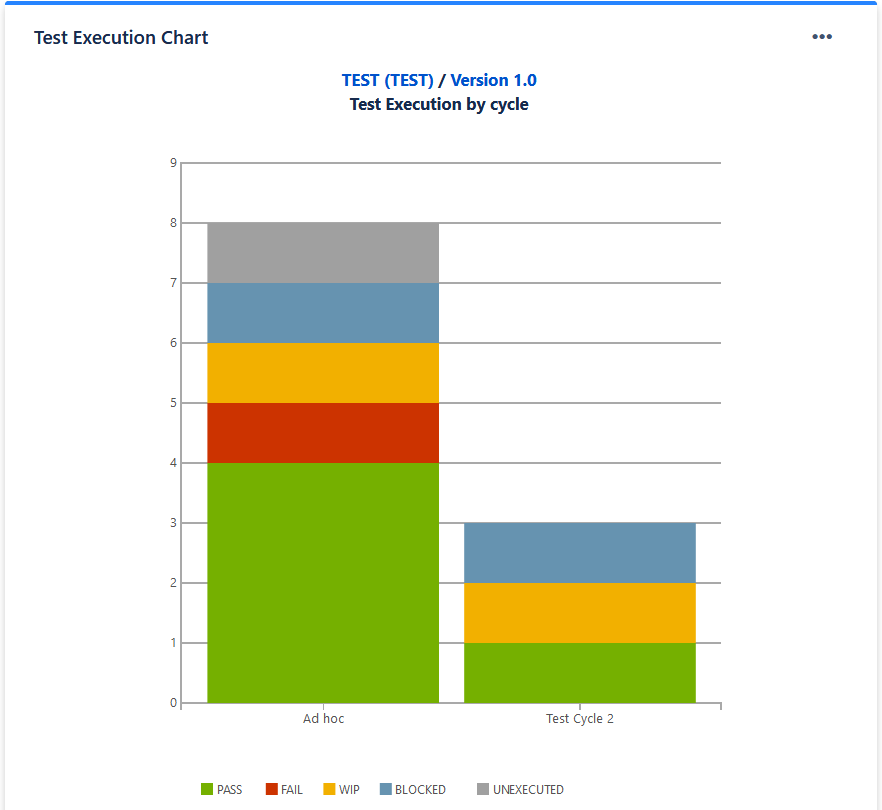
Test Execution
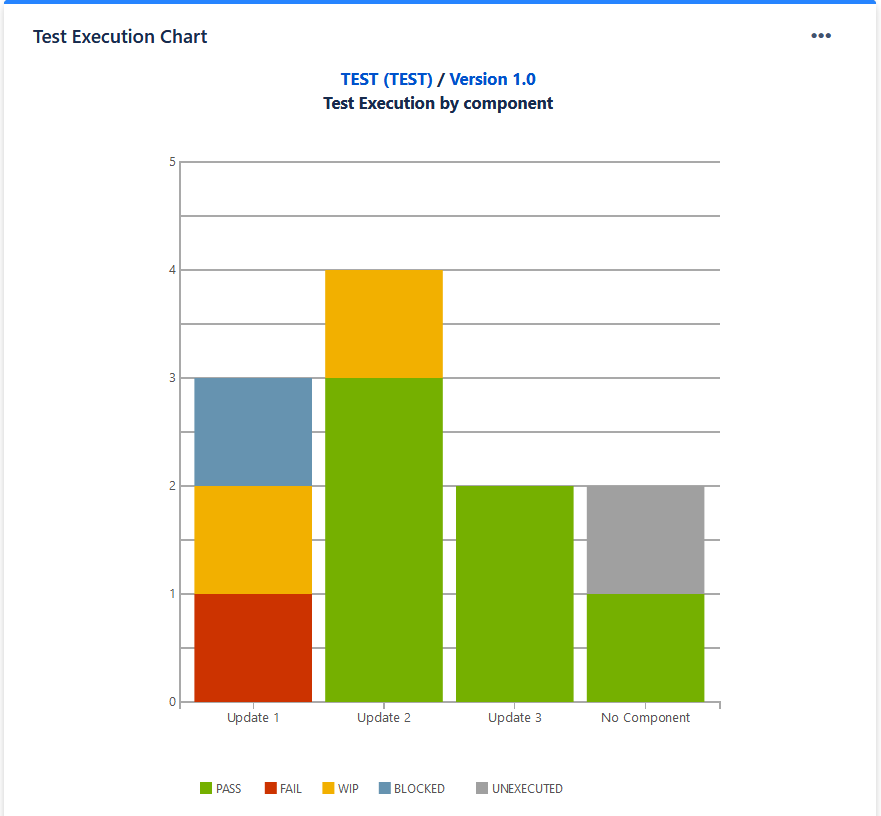
The Test Execution gadget displays totals of tests that have been executed for a particular project-version combination. The version here is the Fixed Version. This can be customized to show the data grouped either by Test Cycles, Components or Users.
 |
 |
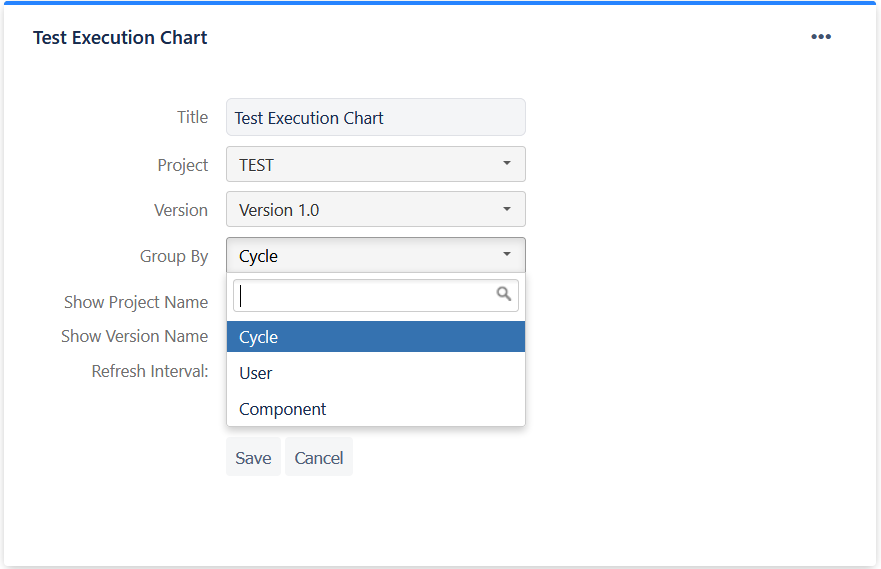
Click the ellipsis button in the top-right corner, and then click Edit to customize the gadget. The Title, Project and Version can be changed. Test Execution data can be grouped by Test Cycle, Component or User. The Refresh Interval can also be modified.
 |
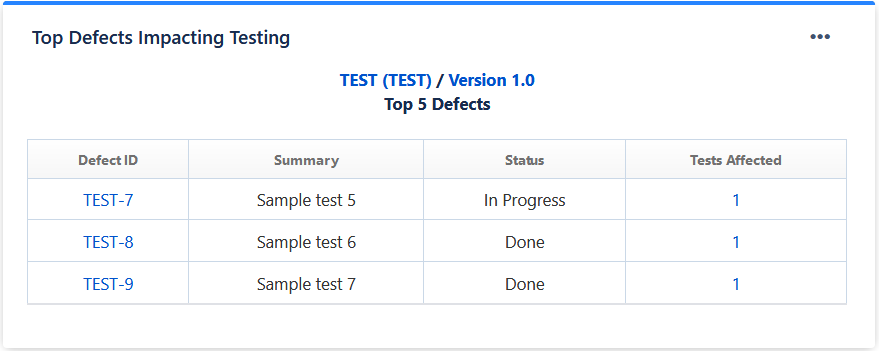
Top Defects Impacting Testing
This is a very useful metric that provides critical and impactful information about which defects are currently holding up the maximum number of tests from passing. This gives project teams a clear indication of which issues they should be focusing their energies on in order to move testing forward. This can also provide a view into how resolving defects have impacted testing.
 |
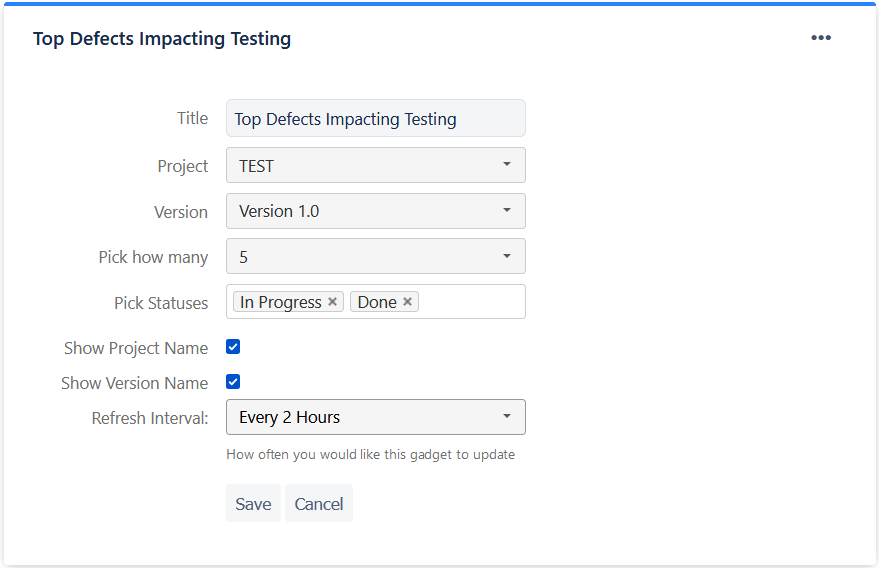
This gadget can be customized to show 5/10/15 top defects for any project-version combination as well as picking one or more statuses of the defect.
 |
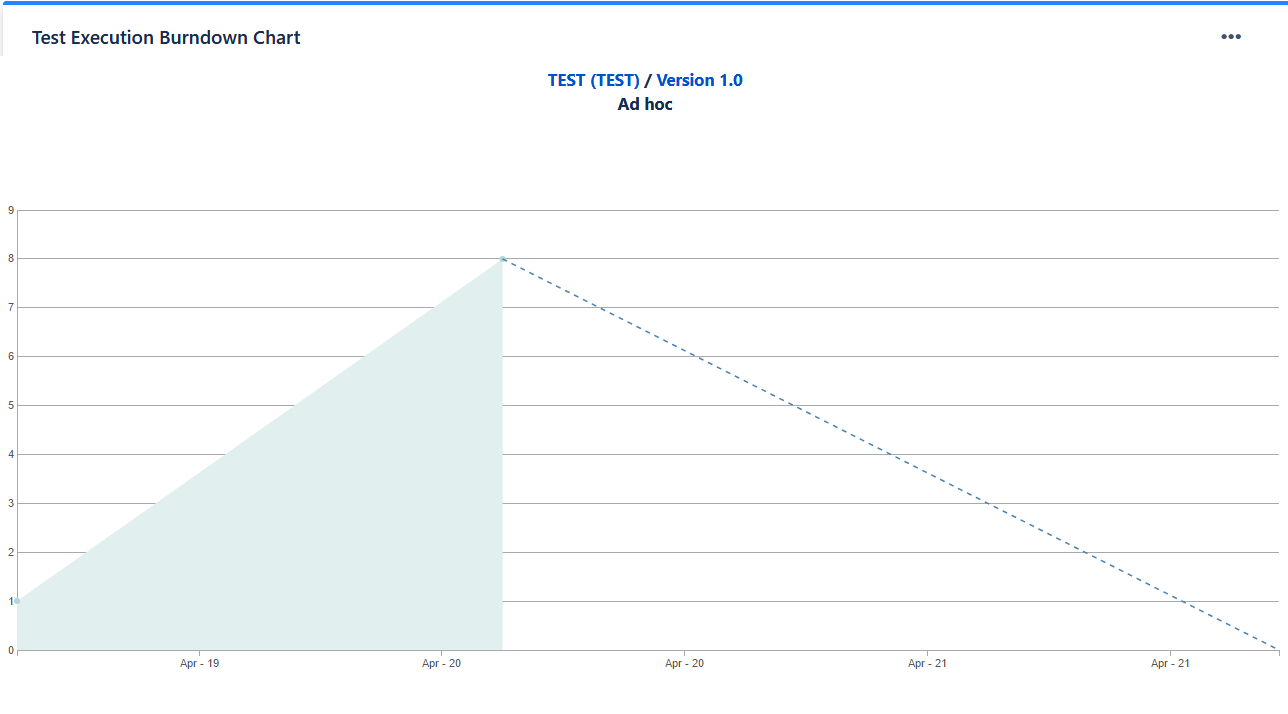
Test Execution Burndown
This metric tracks the progress of a test cycle, providing valuable information regarding how many tests are still unexecuted, the current system date, what the average rate of execution will be and extrapolating to when the projected date of completion would be based on the current rate which gives you the expected completion date.
The formulas used to calculate the average rate of execution and the expected completion date are below:
Average rate of execution calculation: Total number of executed testcases of a cycle / number of days since the execution started.
Expected completion date calculation: Total unexecuted testcases / average rate of execution] days + current system date.
 |
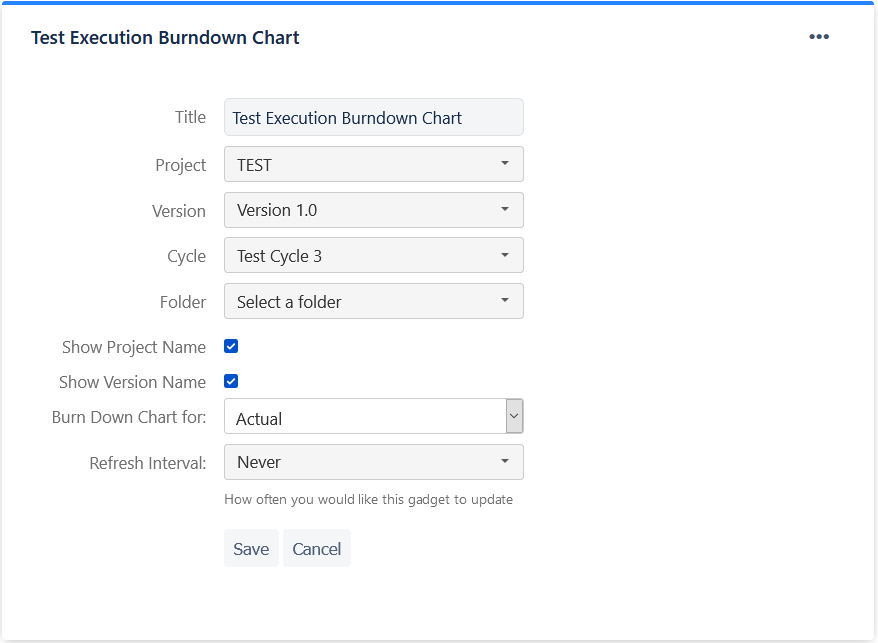
Click the ellipsis button in the top-right corner, and then click Edit to customize the gadget.
 |
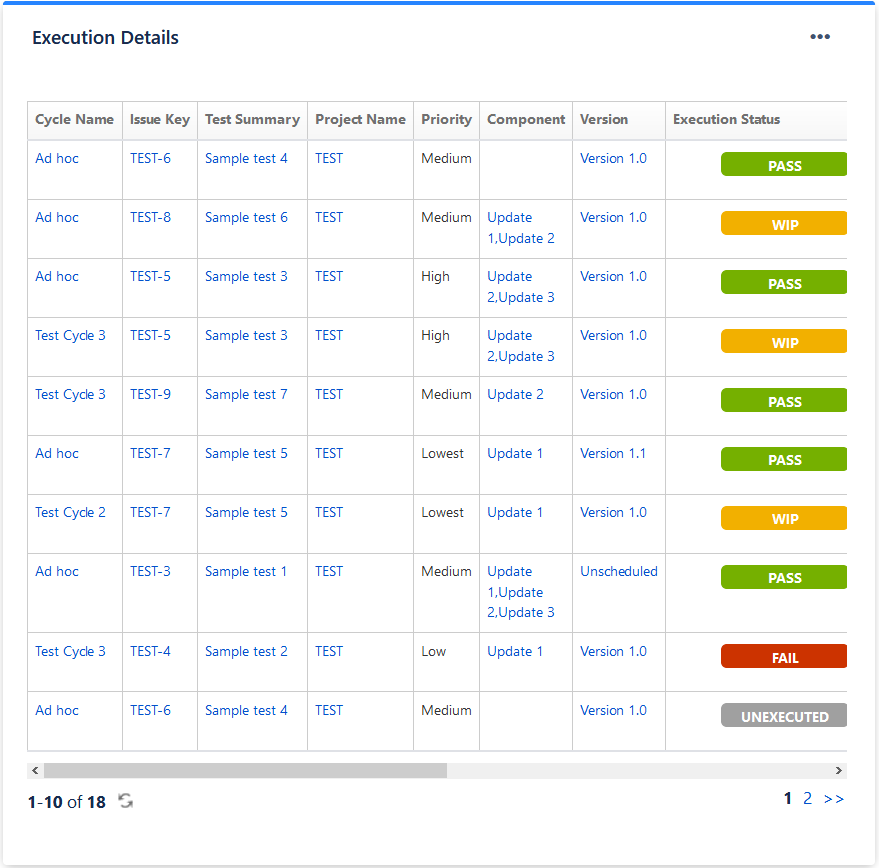
Test Execution Details
This gadget fetches data based on a saved ZQL search (i.e. a test execution filter) or a free-form ZQL query.
 |
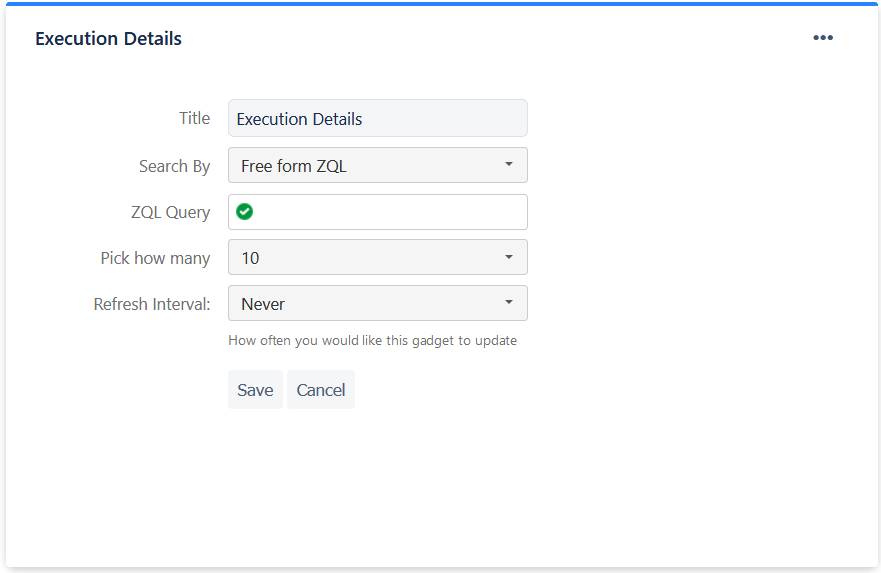
Click the ellipsis button in the top-right corner, and then click Edit to customize the gadget. In the Edit form, you can search for and select a saved filter or type in the ZQL query right there.
 |
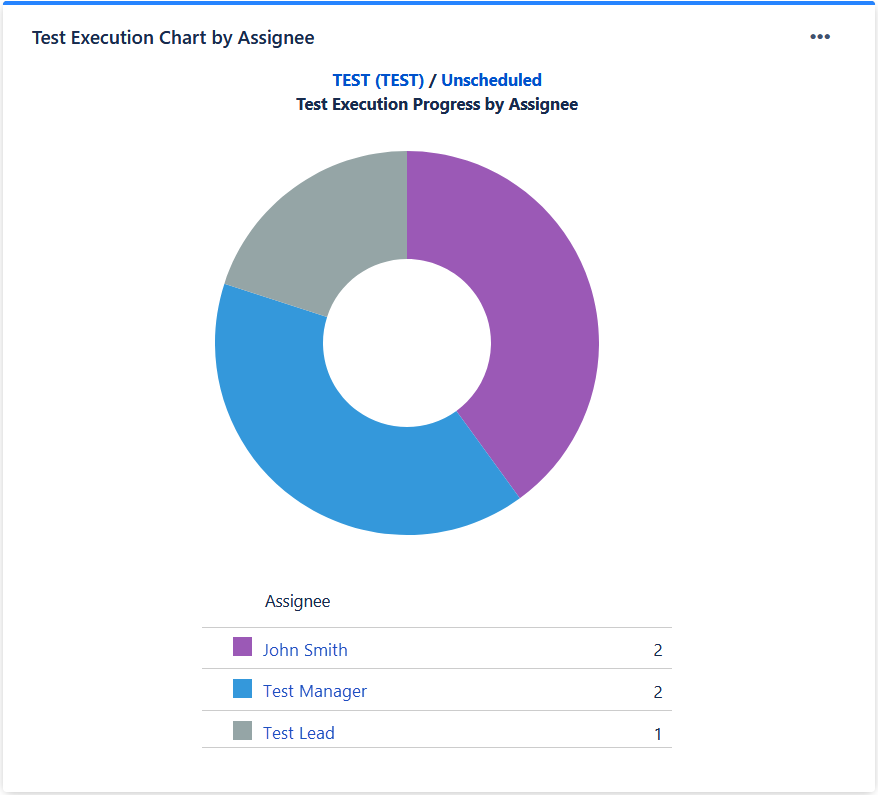
Test Execution Assignment
This gadget shows the test execution statuses arranged per assignee of the executions.
 |
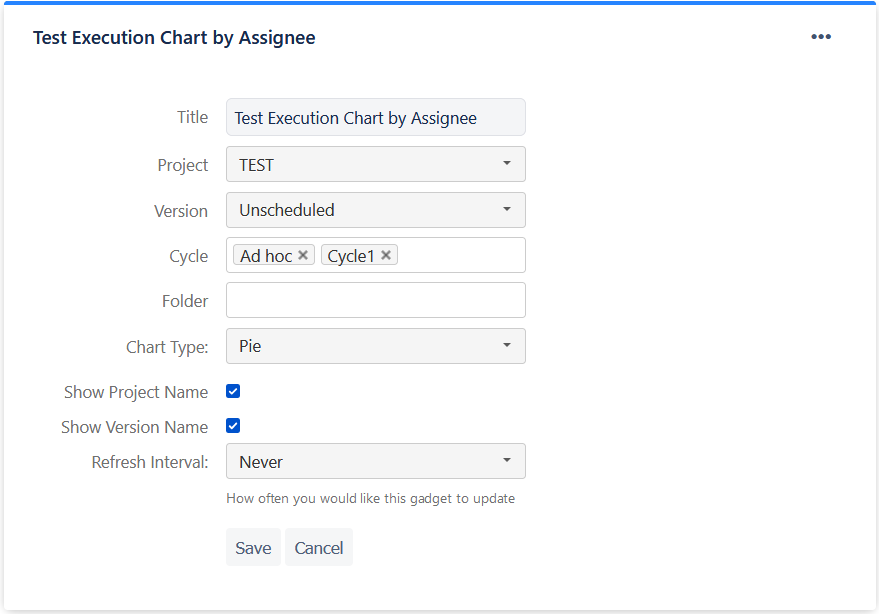
Click the ellipsis button in the top-right corner, and then click Edit to customize the gadget. Dashboard owners can pick the project, version, and cycle with executions and assignments to be displayed. This gadget can be displayed in either pie or tabular formats.
 |
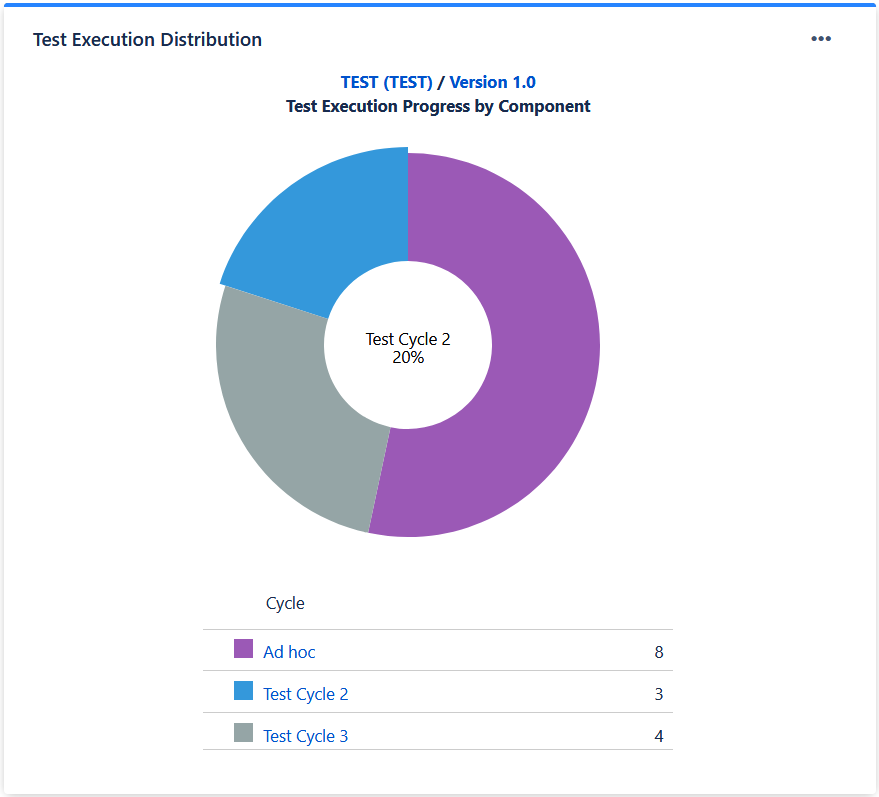
Test Execution Distribution
This gadget shows the test execution distribution arranged by project and version. This can be further filtered to include only a set of components in the executions.
 |
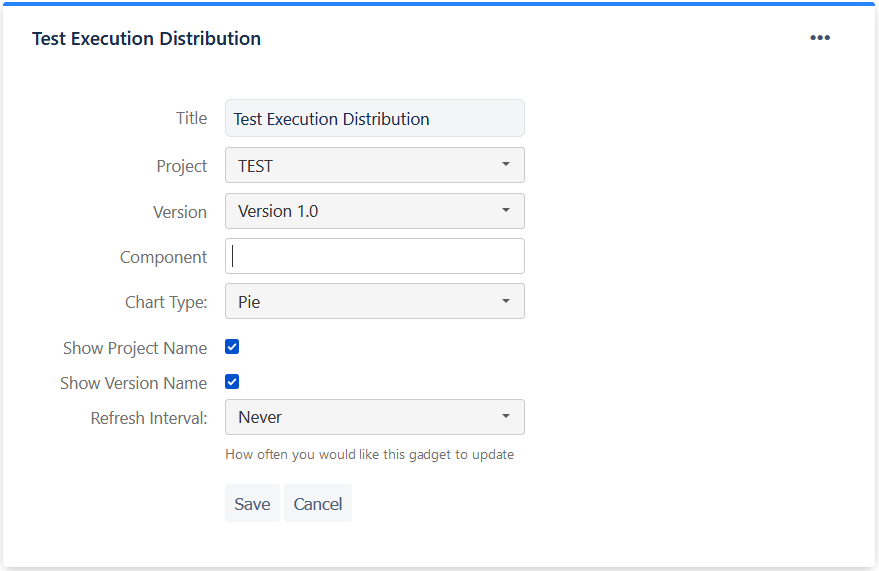
Click the ellipsis button in the top-right corner, and then click Edit to customize the gadget. Dashboard owners can pick the project, version, and components with execution numbers to be displayed. This gadget can be displayed in either pie or tabular formats. Adding a component to the display will show a breakdown of the cycles with executions in the project and version that have those components as part of them. Other executions will not appear.
 |
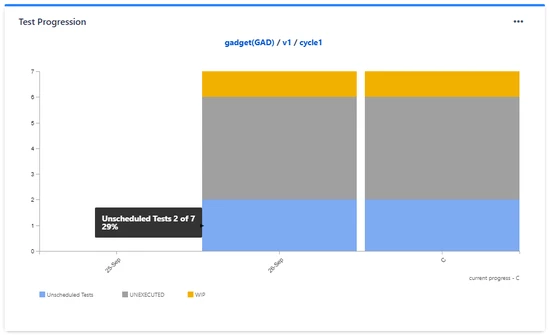
Test Execution Progression
This gadget helps to demonstrate and show the view for the total number of executions throughout a project or version within the last 30 days. Within the gadget, users are able to view all scheduled and unscheduled test cases.
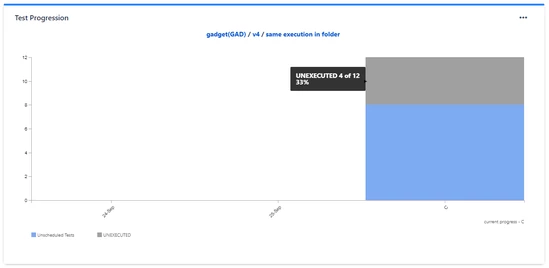 |
Based on the project/version selected, a testing cycle will be shown and a single cycle can be selected at once. Based on the project/version selection, a testing cycle folder will be shown and a single folder can be selected at once.
The gadget will then allow the user to view the current progress of the test case executions.
The gadget will display data based on the following dates: Test created, Test scheduled and Test execution (with the status).
Unscheduled - The number of tests created but not actually scheduled in any testing cycle/folder within the same version.
Scheduled - The number of tests scheduled in any testing cycle/folder within the same version.
Total - The total number of unscheduled and scheduled tests created within the same version.
Note
If you add the same test execution in a testing cycle/folder, the unscheduled count is considered as a single execution. The scheduled count is considered as a separate execution.
Limitation: There is no option to select multiple testing cycles/folders at the same time.
 |
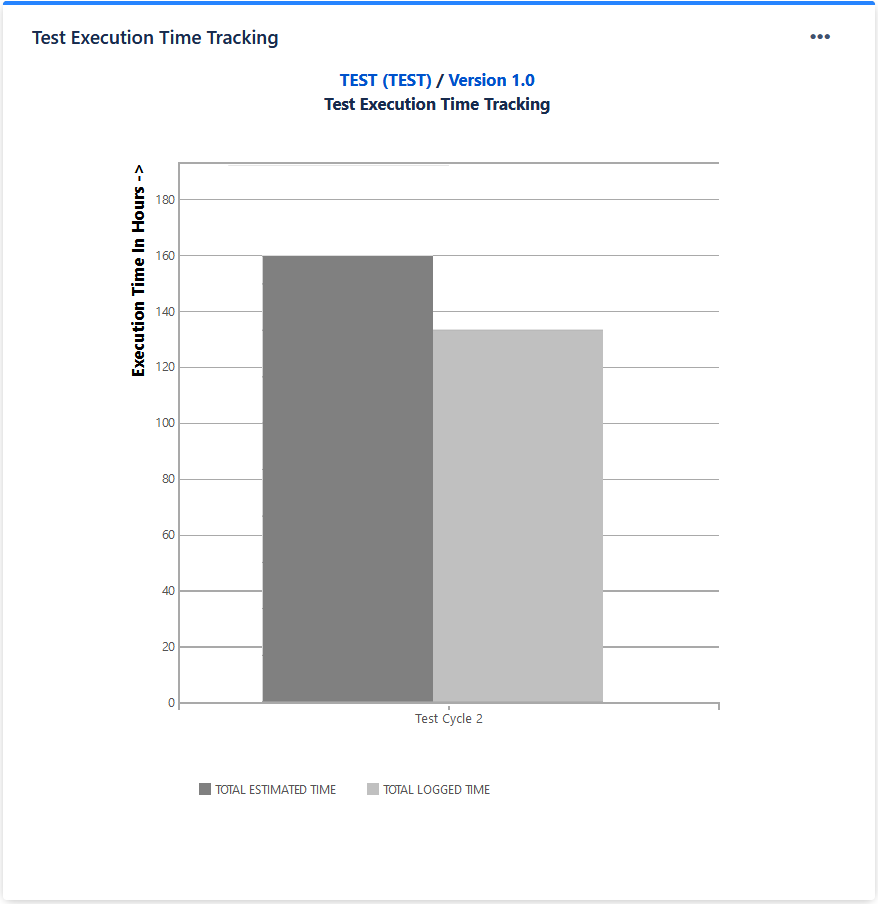
Test Execution Time Tracking by Cycle
The gadget shows the Test Execution Estimated and Logged Time distributed for the selected Test cycles.
The gadget can be displayed in either a grouped bar chart or a tabular chart.
 |
Click the ellipsis button in the top-right corner, and then click Edit to customize the gadget. The user can select options to view the time tracking for cycles by selecting the project, version, cycle, folder, and chart type.
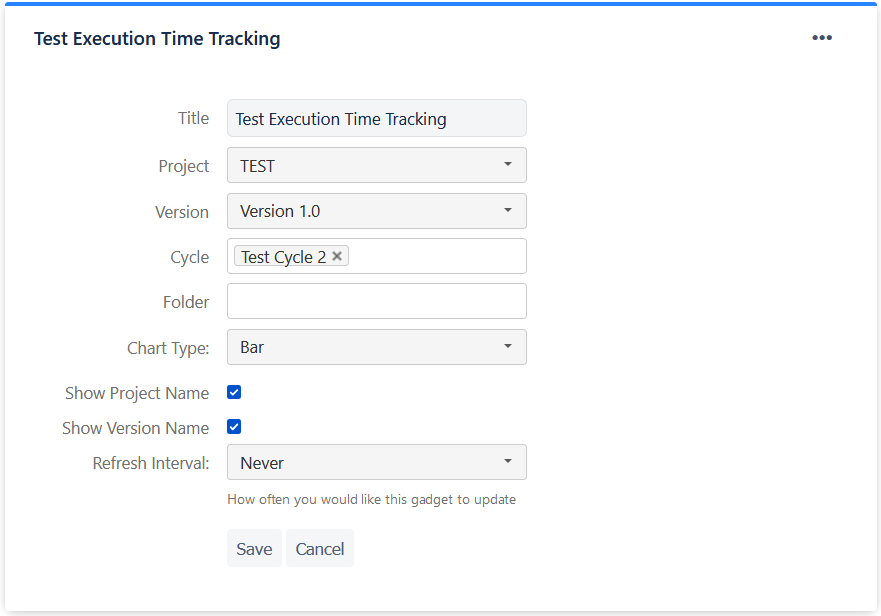 |