Reports
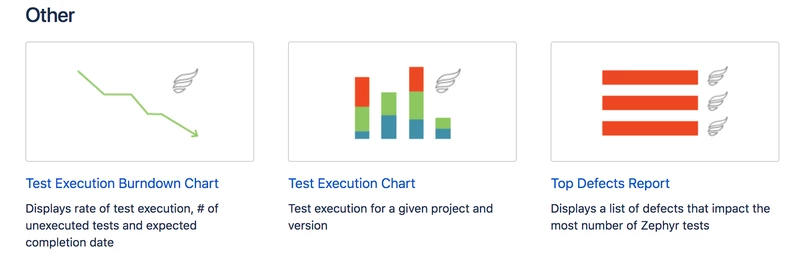
Project-specific testing reports can be viewed via a Jira project's Reports section. The following testing reports are made available with Zephyr Squad:

Open the Reports section and scroll to the section called Other. Select one of the available report templates and you will be able to custom the data observed on the report with the options presented.
 |
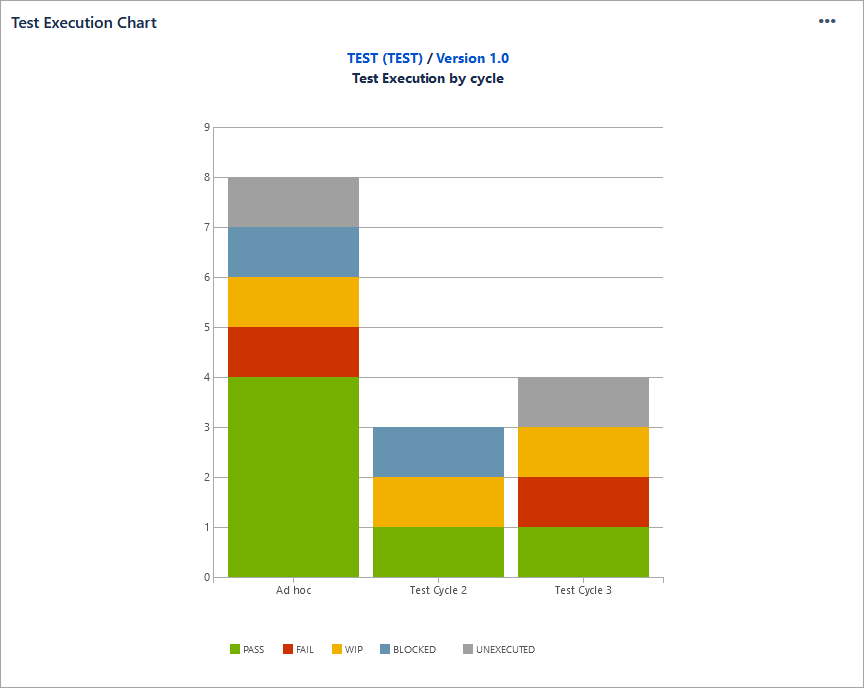
Test Execution Chart
The Test Execution Chart displays execution information for the selected project and version:
 |
Click the ellipsis button in the top-right corner, and then click Edit to customize the chart. The Title, Project and Version can be changed. Test Distribution data can be grouped either by Component, User or Cycle. The Refresh Interval can also be modified:
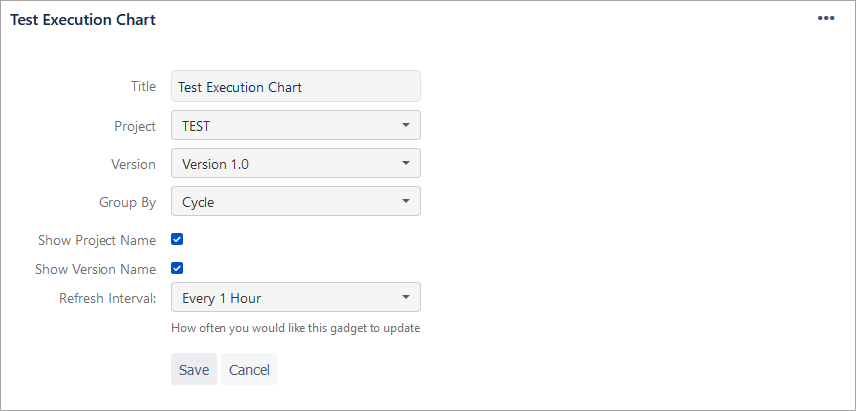 |
After configuring the chart, click Save to apply the changes.
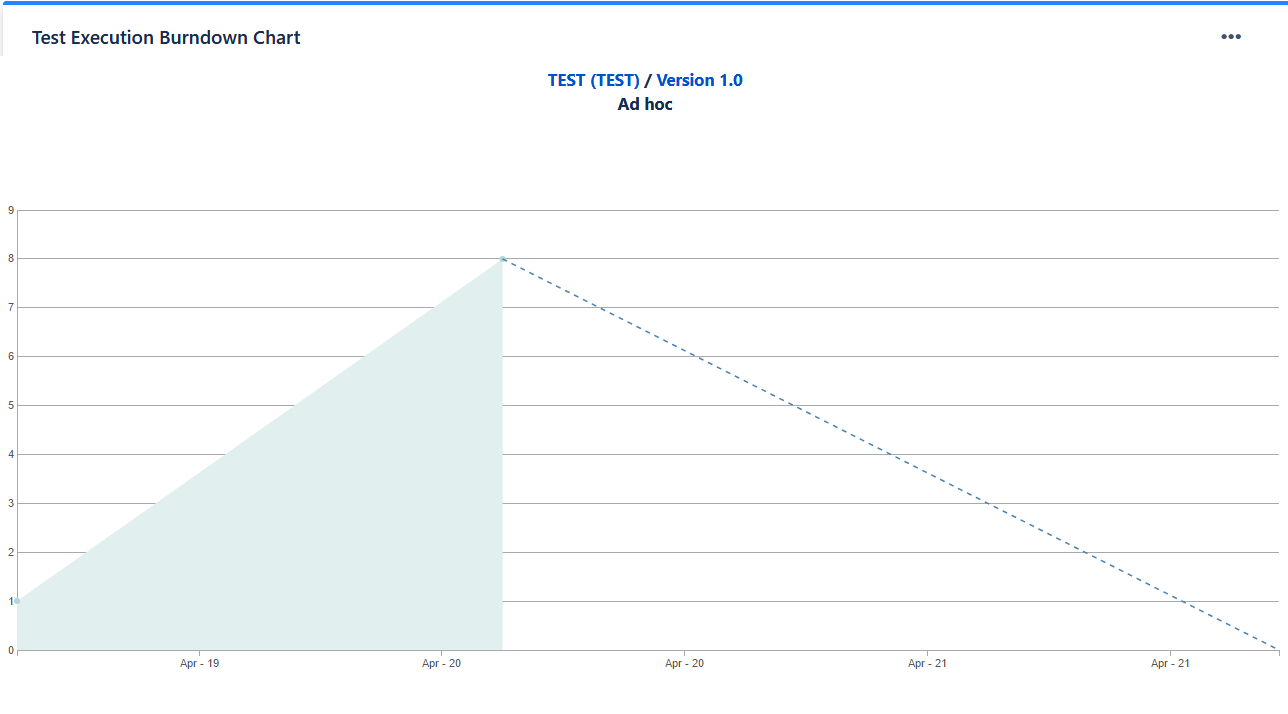
Test Execution Burndown Chart
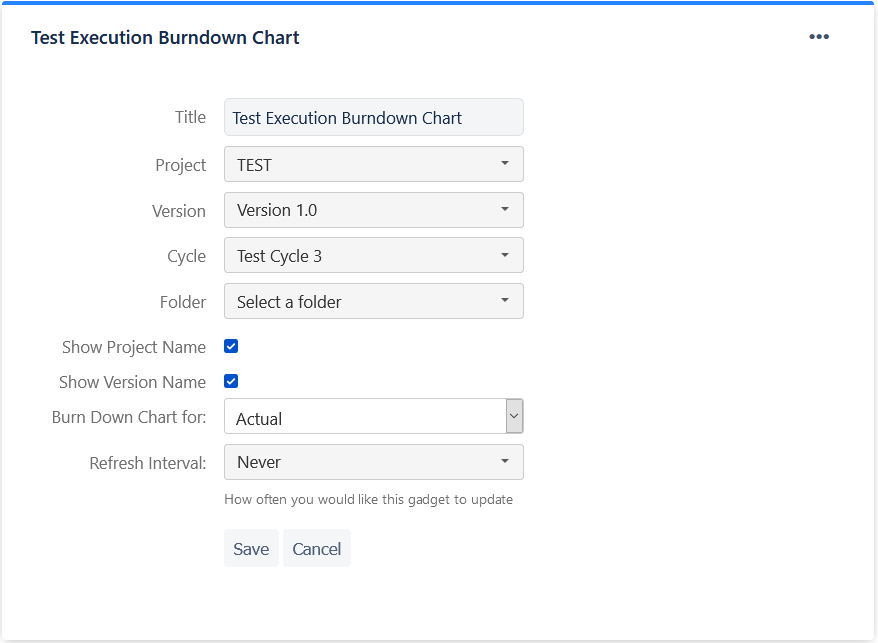
The Test Execution Burndown Chart will display cycle execution information in terms of a timeline for the selected project and version:
 |
Click the ellipsis button in the top-right corner, and then click Edit to customize the chart:
 |
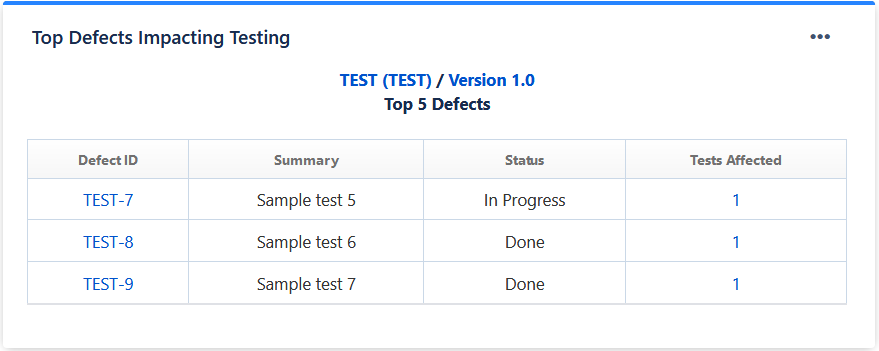
Top Defects Impacting Testing
The Top Defects Impacting Testing report will show a list of the defects which are stopping the most amount of executions from passing. This is purely numerical and does not take priority into account:
 |
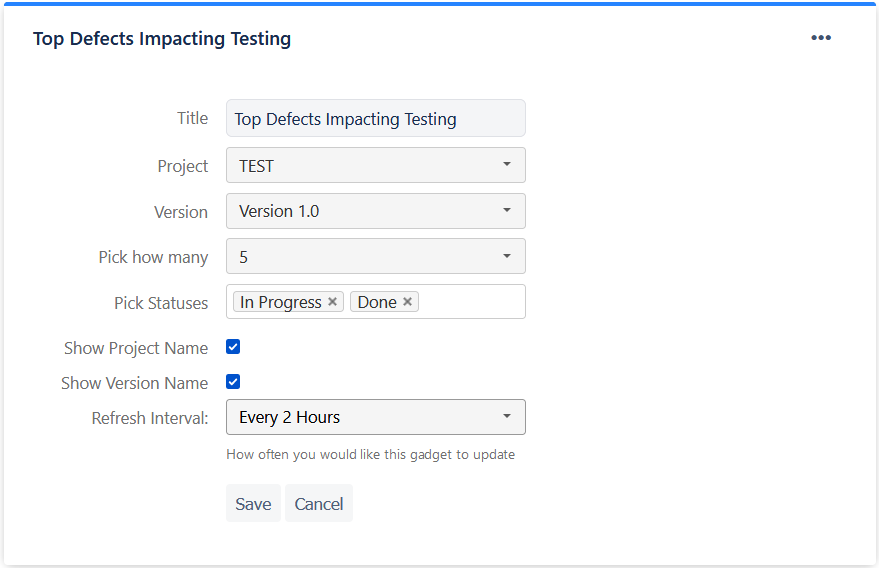
To configure the chart, click the ellipsis button in the top-right corner, and then click Edit. This chart can be customized to show 5/10/15 top defects for any project-version combination as well as picking one or more statuses of the defect:
 |