About AlertSite
AlertSite monitors your websites, APIs, email servers, Web-connected devices and other resources to check if they are up and running. It sends test requests or simulates user actions in your Web application regularly to determine if it is fast enough and meets your SLAs.
If AlertSite detects an issue, it immediately sends you a notification and forms a detailed report that helps you identify the bottleneck and dig down to the cause of the problem.
Monitors
AlertSite includes a bunch of monitors to create different type of checks for various resource types:
-
The single-URL and “ping” monitors send requests to your website or Web-connected device to ensure that it is on.
-
The AlertSite cutting edge transaction recorder, DéjàClick, helps you monitor Web applications by recording user actions for critical business transactions across the most common paths in your application. You then run the recorded scripts regularly to make sure your Web application functions as expected. The scripts work for simple HTML pages as well as for complex rich Internet applications (RIAs), which have become the backbone of web commerce. Since DéjàClick is browser-based, it gives you a true browser perspective of performance.
-
Another possible alternative to check transactions on your website is to run Selenium tests with the special Selenium monitor.
-
Mobile monitors help you ensure your website works well for those visitors who access it from phones or tablets.
-
To test APIs, AlertSite offers a special monitor that runs SoapUI tests.
For complete information on monitors and their settings, see Monitors.
UI Overview
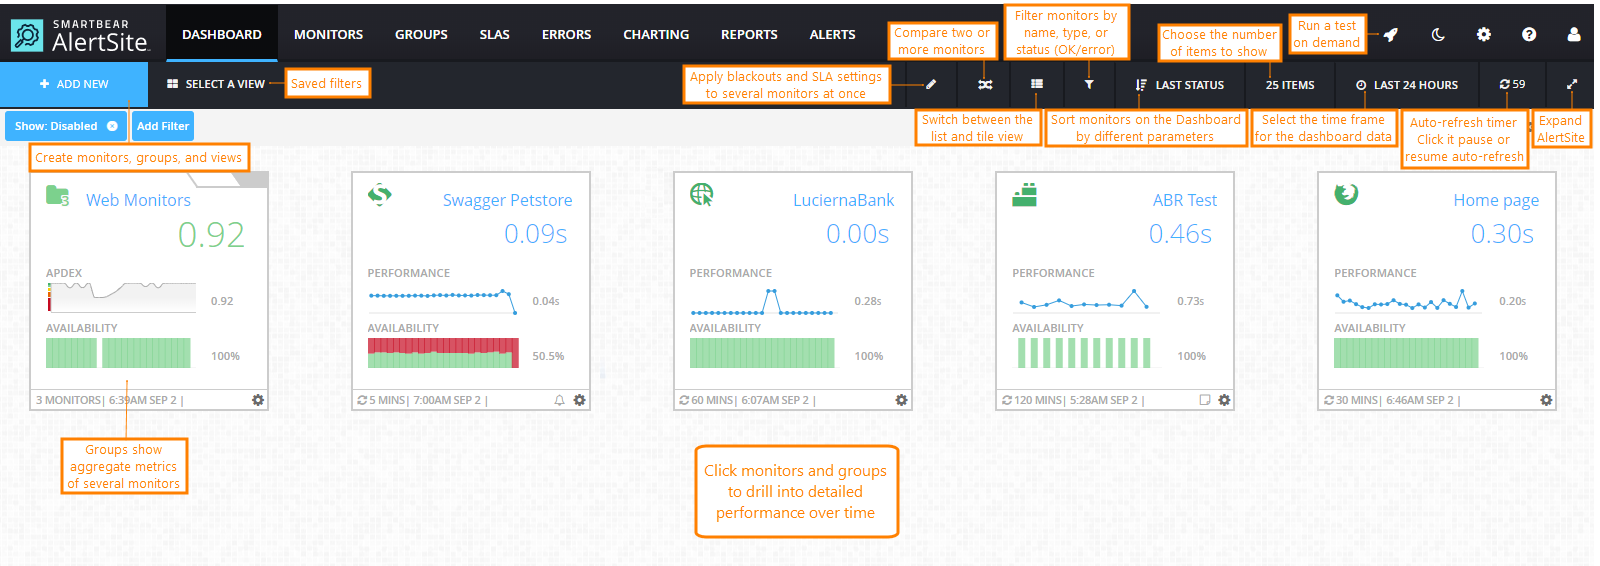
After you log in to AlertSite, you will see the Dashboard. The Dashboard shows the statuses of all your monitors, so you can see whether your websites and servers function properly over the selected period (12 hours, 24 hours, 7 days, or 30 days). In the Dashboard, you can also create new monitors, organize them into groups, compare monitor performance, and drill into detailed results.
If needed, you can filter monitors by various parameters, organize them into group for convenient viewing and managing, or view them as a list or a set of tiles. You can also change the dashboard theme to the Night or Day mode by using the or button on the toolbar:
The top menu provides access to various features which will help you use AlertSite to the full extent:
-
Monitors – Shows detailed results of your monitors, such as individual monitor results, your website availability, monitor performance history, and summary results over the selected period.
-
Groups – View aggregate metrics of your monitor groups.
-
SLAs – Assigns service level agreements (SLA) and tracks your SLA compliance.
-
Errors – Lists the latest errors from all monitors.
-
Charting – Creates charts to visualize your monitor metrics.
-
Reports – Creates and schedules reports that can be sent via email or saved to your computer.
-
Alerts – Helps you configure alert recipients and customize alert templates.
How Monitors Work
The monitors run automatically at configured intervals. They access your website to check if it is available, and measure the response time. The actual check a monitor performs depends on the monitor type and settings. If a monitor discovers an error (for example, your website is down), it sends an alert to your configured alert recipients. You can also see the results in the Availability History and Performance History tiles on the AlertSite dashboards.
In the monitor settings, you can configure blackout periods – the time when your monitor will be off. If you need to run an isolated check, for example, to verify the monitor settings, you can use the “Test on Demand” command.
In AlertSite, monitors can be run in more than 80 locations around the world. We call them monitoring locations. You select locations when configuring a monitor. Checks from different locations can run concurrently or in series.
The firewalls running on the side of the checked website should allow connections from monitoring locations. You can find the location IP addresses in the Appendixes section of the AlertSite documentation.
You can also set up private locations to monitor Web applications from your network.
Alerts
When a monitor discovers an issue, it sends you an alert. AlertSite supports various notification methods: Slack and email messages, phone calls, SMS messages, and many others.
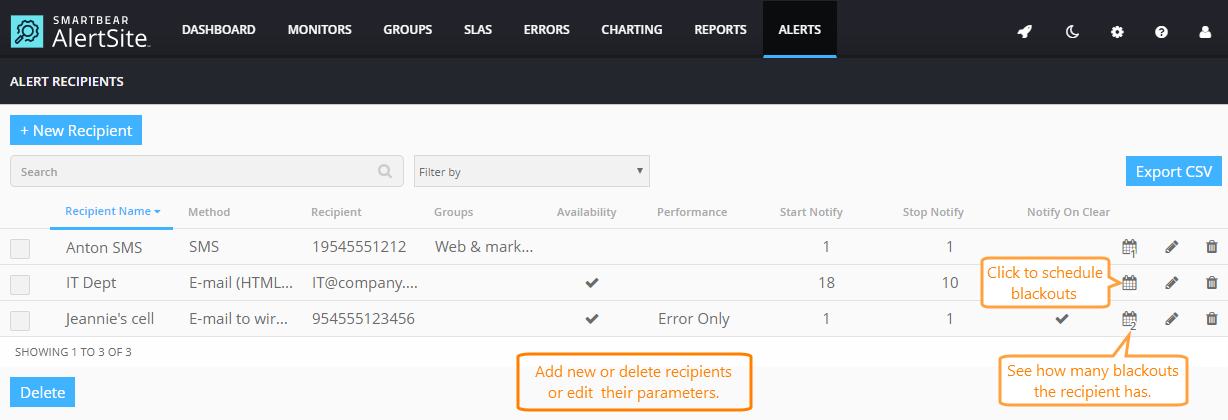
To receive alerts from monitors, you need to create and configure alert recipients in Alerts > Alert Recipients:
You can create and use different templates for different alerts.
For complete information on the notification settings, see Alerts.
How Do I Start?
Take a Quick Tour
From the top menu, select > Take Tour and follow the interactive guide instructions:
Create Your First Monitor
-
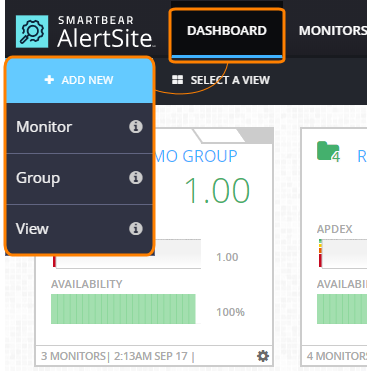
On the AlertSite UXM Dashboard, hover over + Add New, and then select Monitor from the dropdown:
-
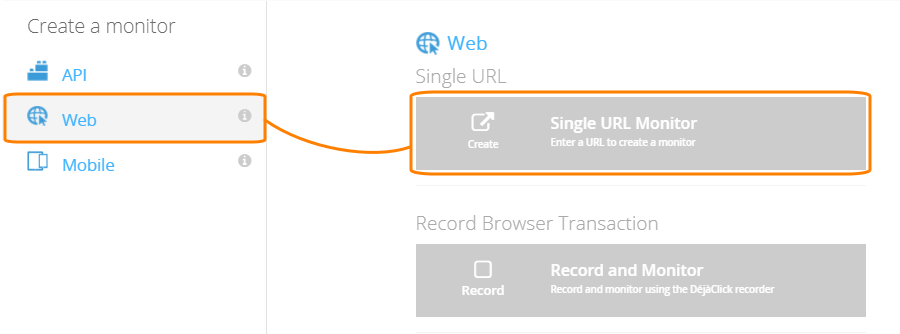
Select the monitor type (Web, API, or Mobile) and the monitor to create:
-
Configure the monitor settings: monitoring locations, run interval and timeout, alerts and others.
Read Tutorials
For a step-by-step description of creation of transaction, API and mobile monitors, see Tutorials.
Set a Time Zone
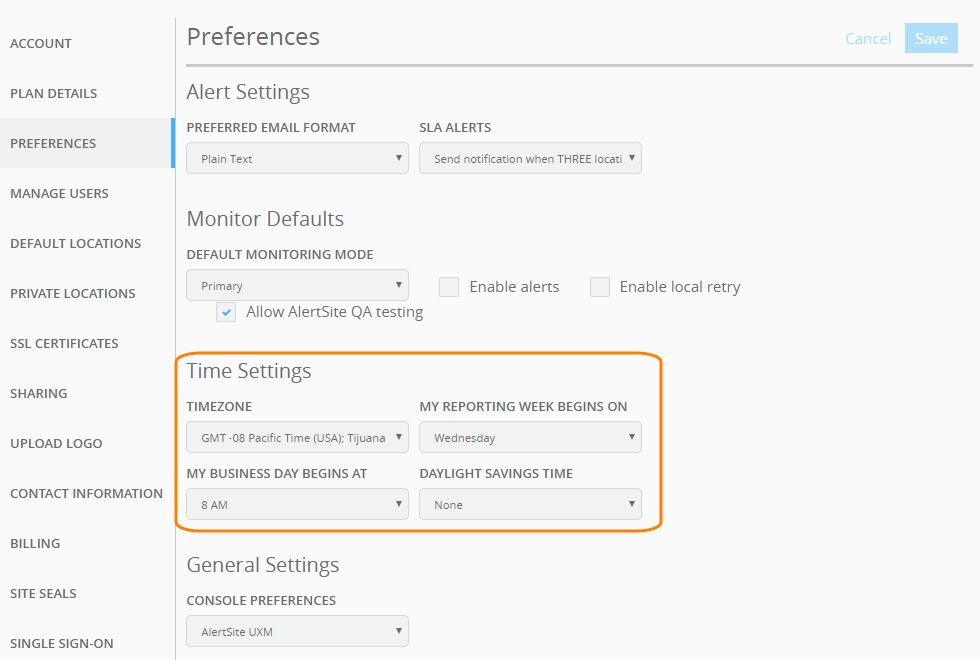
Dashboard timestamps, alerts, and reports use the time zone set to display the date and time. You can change the time zone in the account settings.
Account and Users
By default, you have only one user in your AlertSite account. This is typically enough to start monitoring your websites, servers and resources. As time passes, you may want your co-workers to have access to your monitor settings and results. You grant access by adding users to your AlertSite account.
The permissions the new users will get depend on their role. For example, Admin users have permissions to do any operation in your account, while Read-Only users can only view monitor results. See Users Roles.
If your account has lots of monitors, you can create subaccounts for easier management.

 See Intructions