
The Monitor Performance dashboard in AlertSite UXM provides an overview of the response time and performance history of the selected monitor. You can compare the current response time with historical performance to see if the performance changes (improves or gets worse) over time.
To view the Monitor Performance dashboard, select Monitors > Performance from the top menu. Then select the desired monitor and time frame.

Click the image to enlarge it.
The dashboard shows:
-
The monitor type (web, API, or mobile), monitoring locations, and run internal.
-
Whether the monitor is enabled, sends alerts, and has an SLA.
-
Response time thresholds that trigger performance alerts.
-
Whether the monitor is enabled for AppDynamics transaction tracing (see AppDynamics Integration).
-
Response time during the last check (full page response time if available, otherwise the base response time).
-
Average response time during the selected time period (successful runs only).
-
Response time chart for the selected time period.
-
For real-browser (DéjàClick) monitors: the average time of each test step.
Admin, Co-Admin and Power Users can change the monitor settings by clicking Edit Monitor.
The Test on Demand button runs an instant test from the monitor’s primary location. Results are displayed on the screen and are not included in the monitor history.
The Chart Monitor button opens the Charting screen where you can create a custom chart with this monitor’s data.
Response Time or Full Page Response Time?
Last Response Time, Performance History, and Action Analysis show the full page response time if available, otherwise they show the base response time. Full page response time is the load time of a page and all of its images, scripts, CSS files, and other objects. This metric is measured for website URL and real-browser monitors with fullpage monitoring.
Average Response Time always shows the response time (not full page response time). Note also that this average includes only successful tests (status 0).
The performance of multi-step monitors is the total time of all steps.
Performance Threshold
This tile shows the response time thresholds that trigger performance alerts. You can configure these thresholds in the monitor settings, as explained in Performance Alerts.
Response time thresholds can be static (a fixed value in seconds) or dynamic (compared to the response time average over the last few days). Both methods trigger an alert when:
-
Current response time average for the last N hours is equal to or greater than:
-
X seconds or % for error
-
Y seconds or % for warning
-
-
When detected from at least N locations.
Performance alerts are usually set on the response time or full page response time, but can also use any other metric – time to first byte, first paint and others. Check the monitor settings to see which metric is used for that monitor.
Performance History Chart
This chart shows the response time of your website or API measured from AlertSite global monitoring locations. You can see the Average response time across all locations, compare the response time By Location, and (for multi-step monitors) By Step. Each point on the chart represents the average response time per the corresponding period – hour or day.
The Metrics list allows you to switch between the response time and its components. For a description of available metrics, see Web Page Load Time.

Click the image to enlarge it.
| Note: | The line chart shows data of successful runs only (status 0). However, clicking any data point zooms into a closer view that shows all test runs, whether successful or not. |
Analyze Performance
Suppose you see a spike in performance history:

Click the image to enlarge it.
First, switch to the By Location view to see if the issue was location-specific:

Click the image to enlarge it.
Browse through the response time metrics to see if a specific network timing contributed to the slowdown. Our example shows high first byte time, which indicates a server delay. Such delays may be caused by high server load, memory issues, inefficient database queries, or latency when making calls to external services.

Click the image to enlarge it.
Click a point of interest to drill into details. The resulting scatter plot shows all monitor runs over the corresponding period. Here you can localize performance issues to a specific period of time.
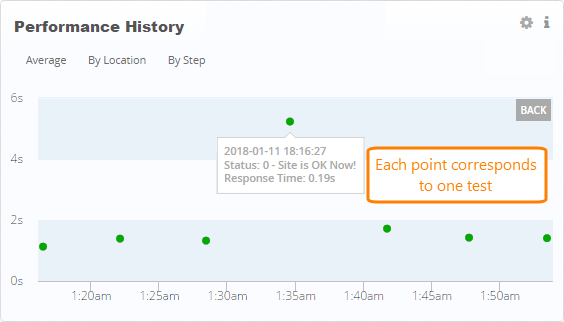
Click the image to enlarge it.
Click a test to see its timestamp and status. If results imply a server-side problem, look for clues in your server logs around that time.
To drill further into details, use the links in the tooltip:
-
View Run – Opens the run results on the Monitor Runs dashboard. The results include the response times for the monitored web page and external resources, page screenshots (for real-browser monitors), transaction traces, HTTP request log, and so on.
-
View Detail Report – Opens a Detail report for this run, with all test steps, their statuses, and response times in a table.
 Tip: How to open the report in a new tab (for printing or saving to your computer)
See Also
AlertSite UXM Dashboard
Monitor Summary
Monitor Runs Dashboard
Monitor Availability Dashboard