A monitor watches over your website, API, Internet-connected device or another resource, checking its availability and performance. Monitors access your web servers or other resources regularly and report the resource availability and response time. You can see the results on AlertSite dashboards.
If a monitor discovers an error (for example, your website is down), an alert is sent to the recipients configured for this monitor.
In AlertSite 1.0, monitors are called devices.
Monitor Types
Available monitor types depend on your AlertSite plan.
Web
Web monitors check websites and web applications. Both http:// and https:// websites are supported.
-
URL monitor checks a single URL via an HTTP request (usually GET).
-
Transaction monitor (also called real-browser monitor or DéjàClick monitor) accesses your website using a real browser – Chrome or Firefox. This monitor provides additional diagnostic information like user experience metrics, detailed load times of the page and of all its external files, and page screenshots. Transaction monitors can also run complex multi-step scenarios like placing an order, searching a site, or logging in. You can create these monitors by recording actions on your website using the AlertSite in-browser recorder.
-
Selenium monitor runs a Selenium Java script that tests your website in Chrome or Firefox. The monitor reports the test status (OK or error) and the web page performance data. See Website Monitoring With Selenium and AlertSite.
API
API monitors ensure that your own and third-party APIs are working correctly. Both SOAP and REST APIs are supported.
-
API endpoint monitor sends one or more HTTP requests to verify the API availability, response time, and response contents. You can also use OpenAPI (Swagger) definitions to configure the requests.
-
SoapUI monitor runs API tests created with ReadyAPI or SoapUI from AlertSite global locations. The passed tests have the OK status, the failed tests are reported as availability errors and trigger alerts.
Mobile
Mobile monitors allow you to monitor mobile web sites and native applications.
-
Mobile web monitor emulates a user navigating your mobile web site using a mobile device, such as iPhone, iPad, Samsung Galaxy, and so on. To do this, the monitor emulates the screen size and user agent of the corresponding mobile device. You create mobile web monitors by recording actions on your site using the AlertSite in-browser recorder.
-
BitBar monitor (also called real device monitor) runs mobile tests on real phones and tablets in BitBar. Native, web and hybrid mobile applications are supported. This requires a BitBar account.
-
Email (POP), Email (SMTP) and Email (IMAP) monitors check that your email servers are accessible and accept connections. These monitors connect to your email server using the corresponding protocol (POP, SMTP or IMAP), verify the response and close the connection.
-
Round-trip email monitor tests end-to-end delivery of emails. It sends an email from a location to an email box, logs in to that box, then finds and deletes the message.
FTP
FTP monitor tests connectivity to your FTP server and, optionally, authentication and file upload/download.
Network
Network monitors test the connection to your servers and Internet-connected devices.
-
TCP monitor tests the connection to the specified server and port.
-
Ping monitor pings the specified server or device to test for availability and potential network latency. The tested server must allow incoming ICMP packets.
-
DNS (Name Server) monitor tests the DNS lookup for a specific domain and compares the returned IP address with the expected IP address.
Where Monitors Run
To ensure your website or resource is available throughout the world, AlertSite runs tests from various monitoring locations around the world. You select the desired locations in the monitor settings. You can also set up private locations in your local network.
When configuring a monitor, the monitoring mode determines how the test proceeds from the available locations. If your monitor uses several AlertSite locations, the tests at these locations can run simultaneously or one at a time.
Monitor Statistics
AlertSite UXM
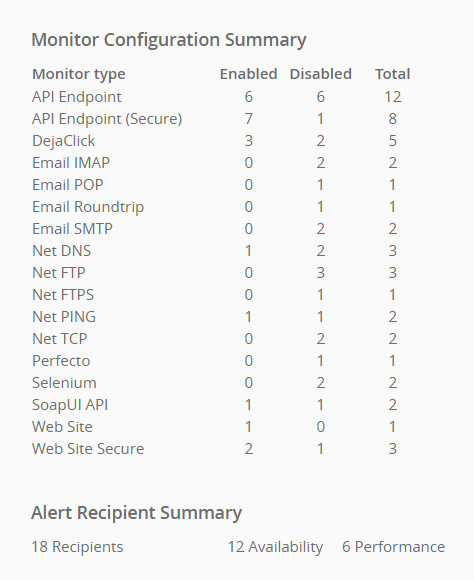
AlertSite Dashboard displays all of your monitors. You can also see some monitor statistics in > Settings > Account. The statistics include the number of monitors by type and the number of enabled and disabled monitors.
AlertSite 1.0
AlertSite Dashboard displays all of your monitors. You can also see some monitor statistics in Dashboard > Home > Account Summary. The statistics include the number of monitors by type and the number of enabled and disabled monitors.

