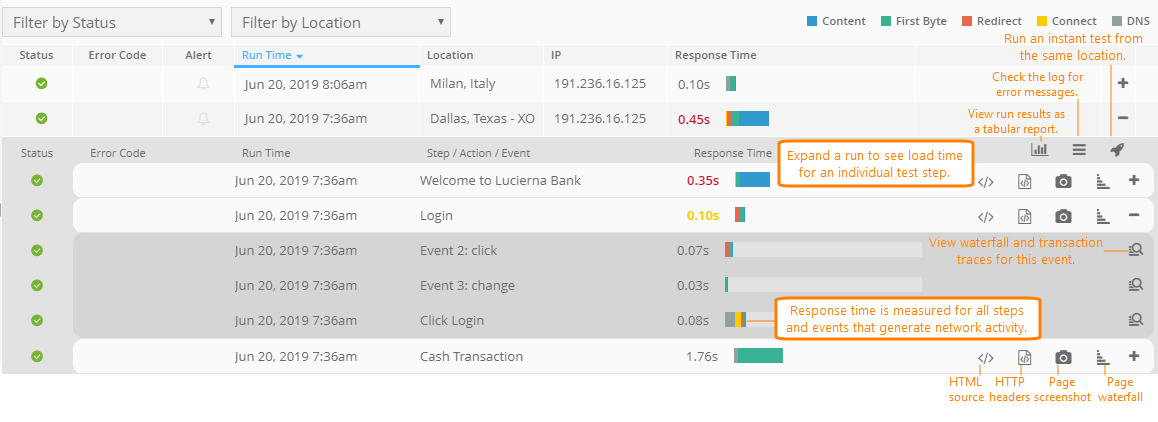
AlertSite Runs dashboard shows individual monitor results over the selected period. You can see the test time, status (success or error), and the response time breakdown into DNS time, connect time, and other components. This helps you understand how much time is spent in various network activities when loading your website.
View Monitor Runs
You can access Monitor Runs in two ways:
-
From the AlertSite main menu:
-
Select Monitors > Runs from the top menu.
-
Select the desired monitor and time period.
-
-
From the Compare mode:
-
On the toolbar of the Dashboard, click
 Compare.
 -
Select a monitor in the left panel, and then switch to the Runs tab.

The Runs tab is available when one monitor is selected.
-
Find results
You can find results of interest in two ways:
-
Manually: filter results by status to view only failed tests, and sort results by response time to find unusually slow (or fast) responses.
-
Navigate to a specific run from the charts and Run History in the Monitor Summary, Monitor Availability, or Monitor Performance dashboard.
-
Navigate to a specific run from the Errors dashboard.
View Monitor Run details
You can expand the runs to view the results for individual actions and test steps. In the expanded view, click the steps to expand and drill further into details.
The appearance and data of the expanded view depends on the monitor type:
Common features include:
| Feature | Description |
|---|---|
|
The Detail report shows the run results and response times in a table. You can print this report or save it to your computer for offline viewing.
|
|
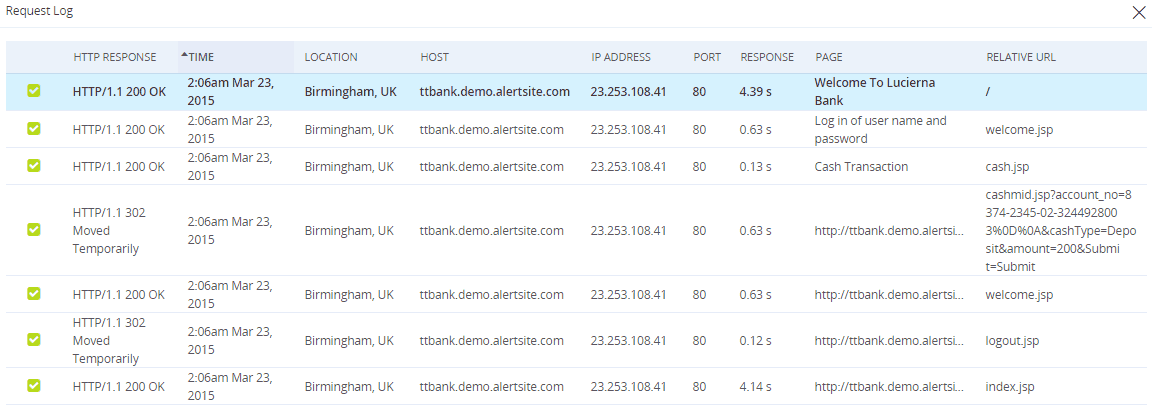
Request Log |
The request log shows all requests to pages or API endpoints made during the test. You can sort the requests by the response time to see which page took the longest time to load. |
|
Runs the monitor immediately from the same location the test was performed from. You can use this to verify that an error condition has been resolved. |
|
|
Shows the page loading timeline, content breakdown, top slowest resources, top largest resources, and detailed timing data for individual resources such as images, JavaScript, or CSS. |
|
|
|
Click a test step (in API monitors) or event (in DéjàClick monitors) to open a request waterfall chart with transaction traces. |
|
Error code |
Test steps that found errors have the error code next to them. For a list of error codes and troubleshooting tips, see AlertSite Status Codes. |
|
Repeating Script |
Monitors with the Enable Local Retry option enabled repeat the failed test from the same location to verify the error. The Repeating Script label indicates the beginning of the local retry. For details, see Local Retry and Remote Verification. |
|
|
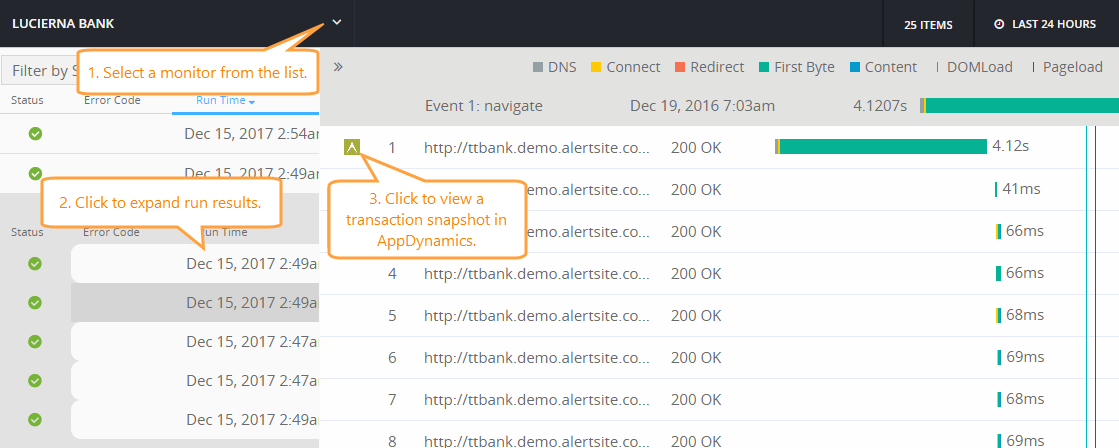
Monitors enabled for AppDynamics transaction traces provide links to view transaction snapshots in AppDynamics. For details, see Transaction Traces below. |
Transaction traces
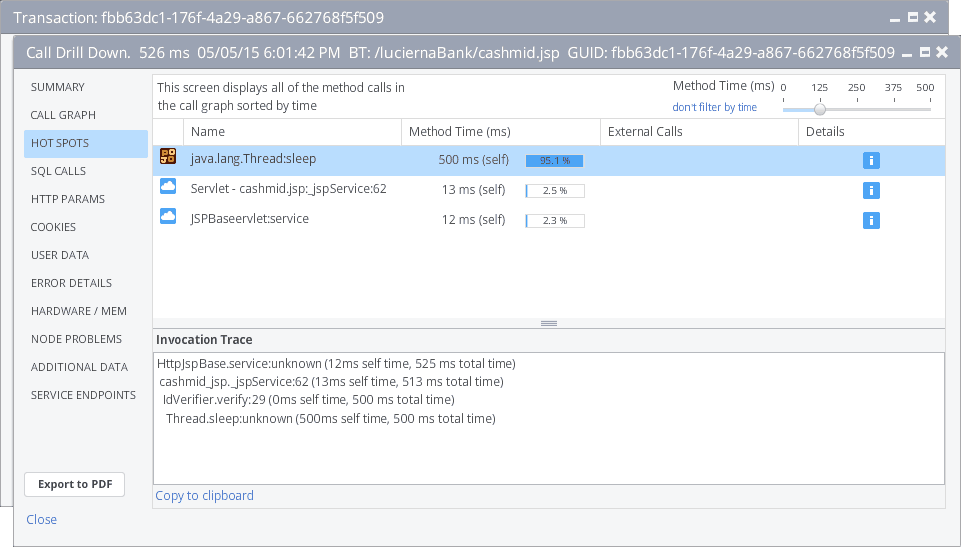
If you integrated AlertSite with AppDynamics, and enabled your monitors for transaction tracing, the monitor run results contain links to AppDynamics transaction snapshots. A transaction snapshot shows method calls and SQL queries executed on the server when it was processing the transaction, and contains other server-side performance details that can help you troubleshoot performance issues.
Pages and requests that have transaction snapshots are marked with the ![]() icon. Click this icon to view the snapshot.
icon. Click this icon to view the snapshot.
Below is an example of a transaction snapshot from AppDynamics. It shows the slowest methods:
See Also
Monitor Summary
Monitor Availability Dashboard
Monitor Performance Dashboard
Web Page Load Time
AlertSite Status Codes


 Tip: How to open the report in a new tab instead of a pop-up

