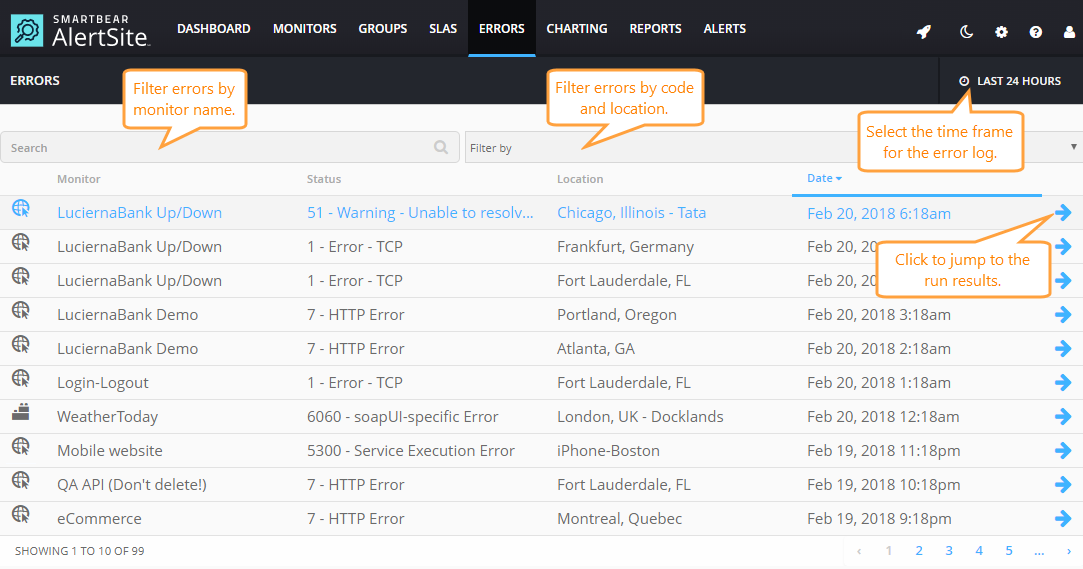
The Errors dashboard in AlertSite UXM shows all errors found by your monitors during the selected time frame – 24 hours, 7 days, or 30 days. You can filter the list by the monitor name, location, or error code.
The dashboard has the following columns:
| Column | Description |
|---|---|
| Monitor | The monitor name and type (website, API, or mobile). |
| Status | AlertSite status code and description. |
| Location | The monitoring location that discovered the error condition. |
| Date | The error date and time. All timestamps use the time zone selected in your AlertSite account preferences. |
To see the details for a specific error, click the arrow button (). This will jump the run results on the Monitor Runs screen. There you can find the detailed actions, load times, and screen captures for the test that uncovered the problem.
See Also
AlertSite Status Codes
Monitor Runs Dashboard
Alert Log
AlertSite Dashboards

