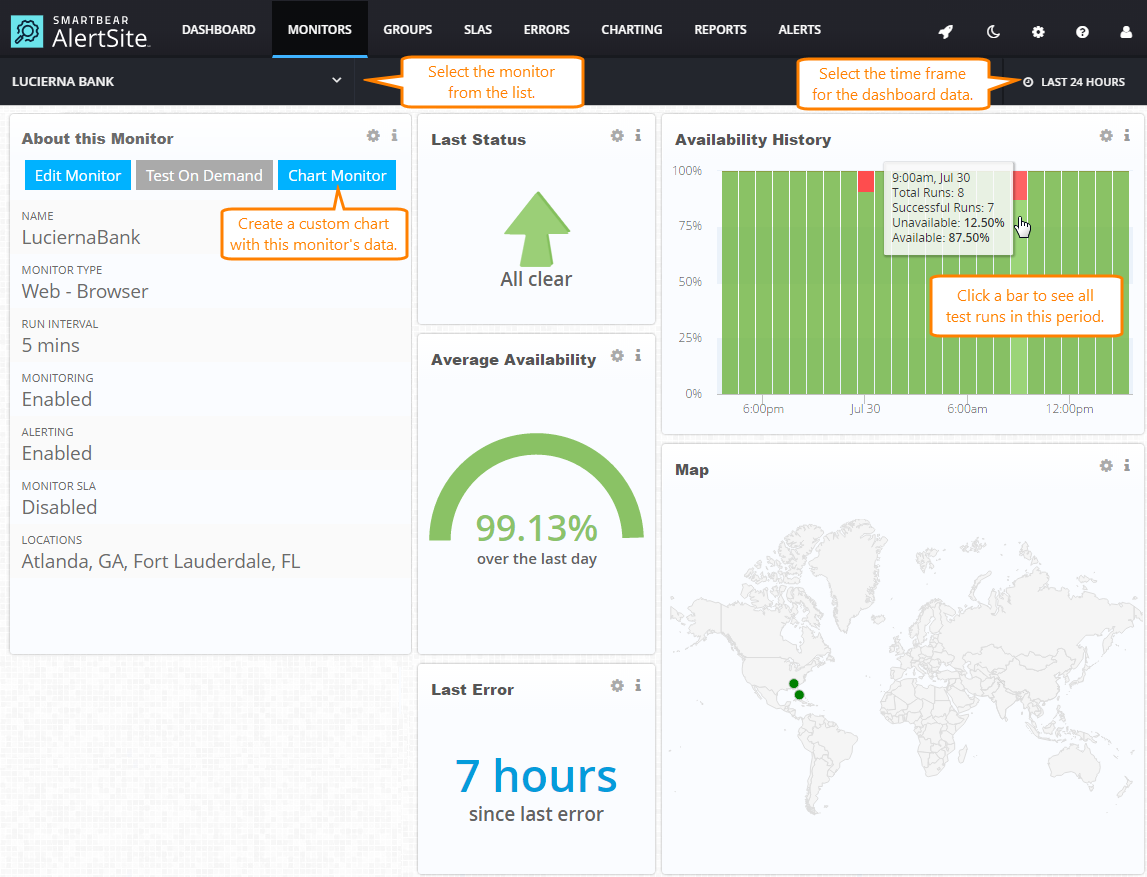
The Monitor Availability dashboard in AlertSite UXM shows your website availability over time. Availability means the monitor run completed successfully, and the run returned a status of 0. A successful run means the monitored website is reachable, returns expected results, and does not experience errors.
To view the Monitor Availability dashboard, select Monitors > Availability from the top menu. Then select the desired monitor and the time frame.
The dashboard shows:
-
The monitor type (web, API, or mobile) and run interval.
-
Whether the monitor is enabled, sends alerts, and has an SLA.
-
The geographical locations used by the monitor, and the latest site status reported from these locations.
-
Latest check status and the time since the last error. Hover over the tiles to see the locations that reported this data.
-
Average availability over the selected period.
Admin, Co-Admin and Power Users can change the monitor settings by clicking Edit Monitor.
The Test on Demand button runs an instant test from the monitor’s primary location. Results are displayed on the screen and are not included in the monitor history.
The Chart Monitor button opens the Charting screen where you can create a custom chart with this monitor’s data.
Availability History Chart
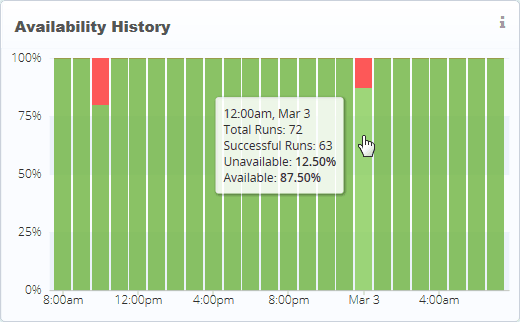
This chart shows the website availability over the selected period as a percentage of successful tests. Each bar represents the average availability per the corresponding period (hour or day).
You can interact with the chart to get to the details of failed or slow tests:
-
Hover over the bars to see the ratio of successful and failed tests.
-
Click a bar to view all test results for that period (hour or day) as a scatter plot. Here, each data point represents one test. Note the failed tests (red points) and tests with high response time.
-
Hover over the points on the scatter plot to see the status of each test. If a test failed, the status includes the error code and description, for example, an HTTP error, timeout, failed keyword validation, and so on.
-
Click a point of interest and use the links in the tooltip to drill further into details:
-
View Run – open the run details on the Monitor Runs dashboard. Here, you can see the response times for the monitored page and its components, HTTP request log, and transaction traces.
-
View Detail Report – open the Detail report for this run, with all test steps and response time details in a table.
 Tip: How to open the report in a new tab (for printing or saving to your computer)
-
Map
The map shows the geographical monitoring locations configured for the monitor. Hover over a location to view the latest check status from this location.
You can add or change the locations in the monitor settings. For details, see Selecting Locations for Monitoring.
See Also
AlertSite UXM Dashboard
Monitor Summary
Monitor Runs Dashboard
Monitor Performance Dashboard


