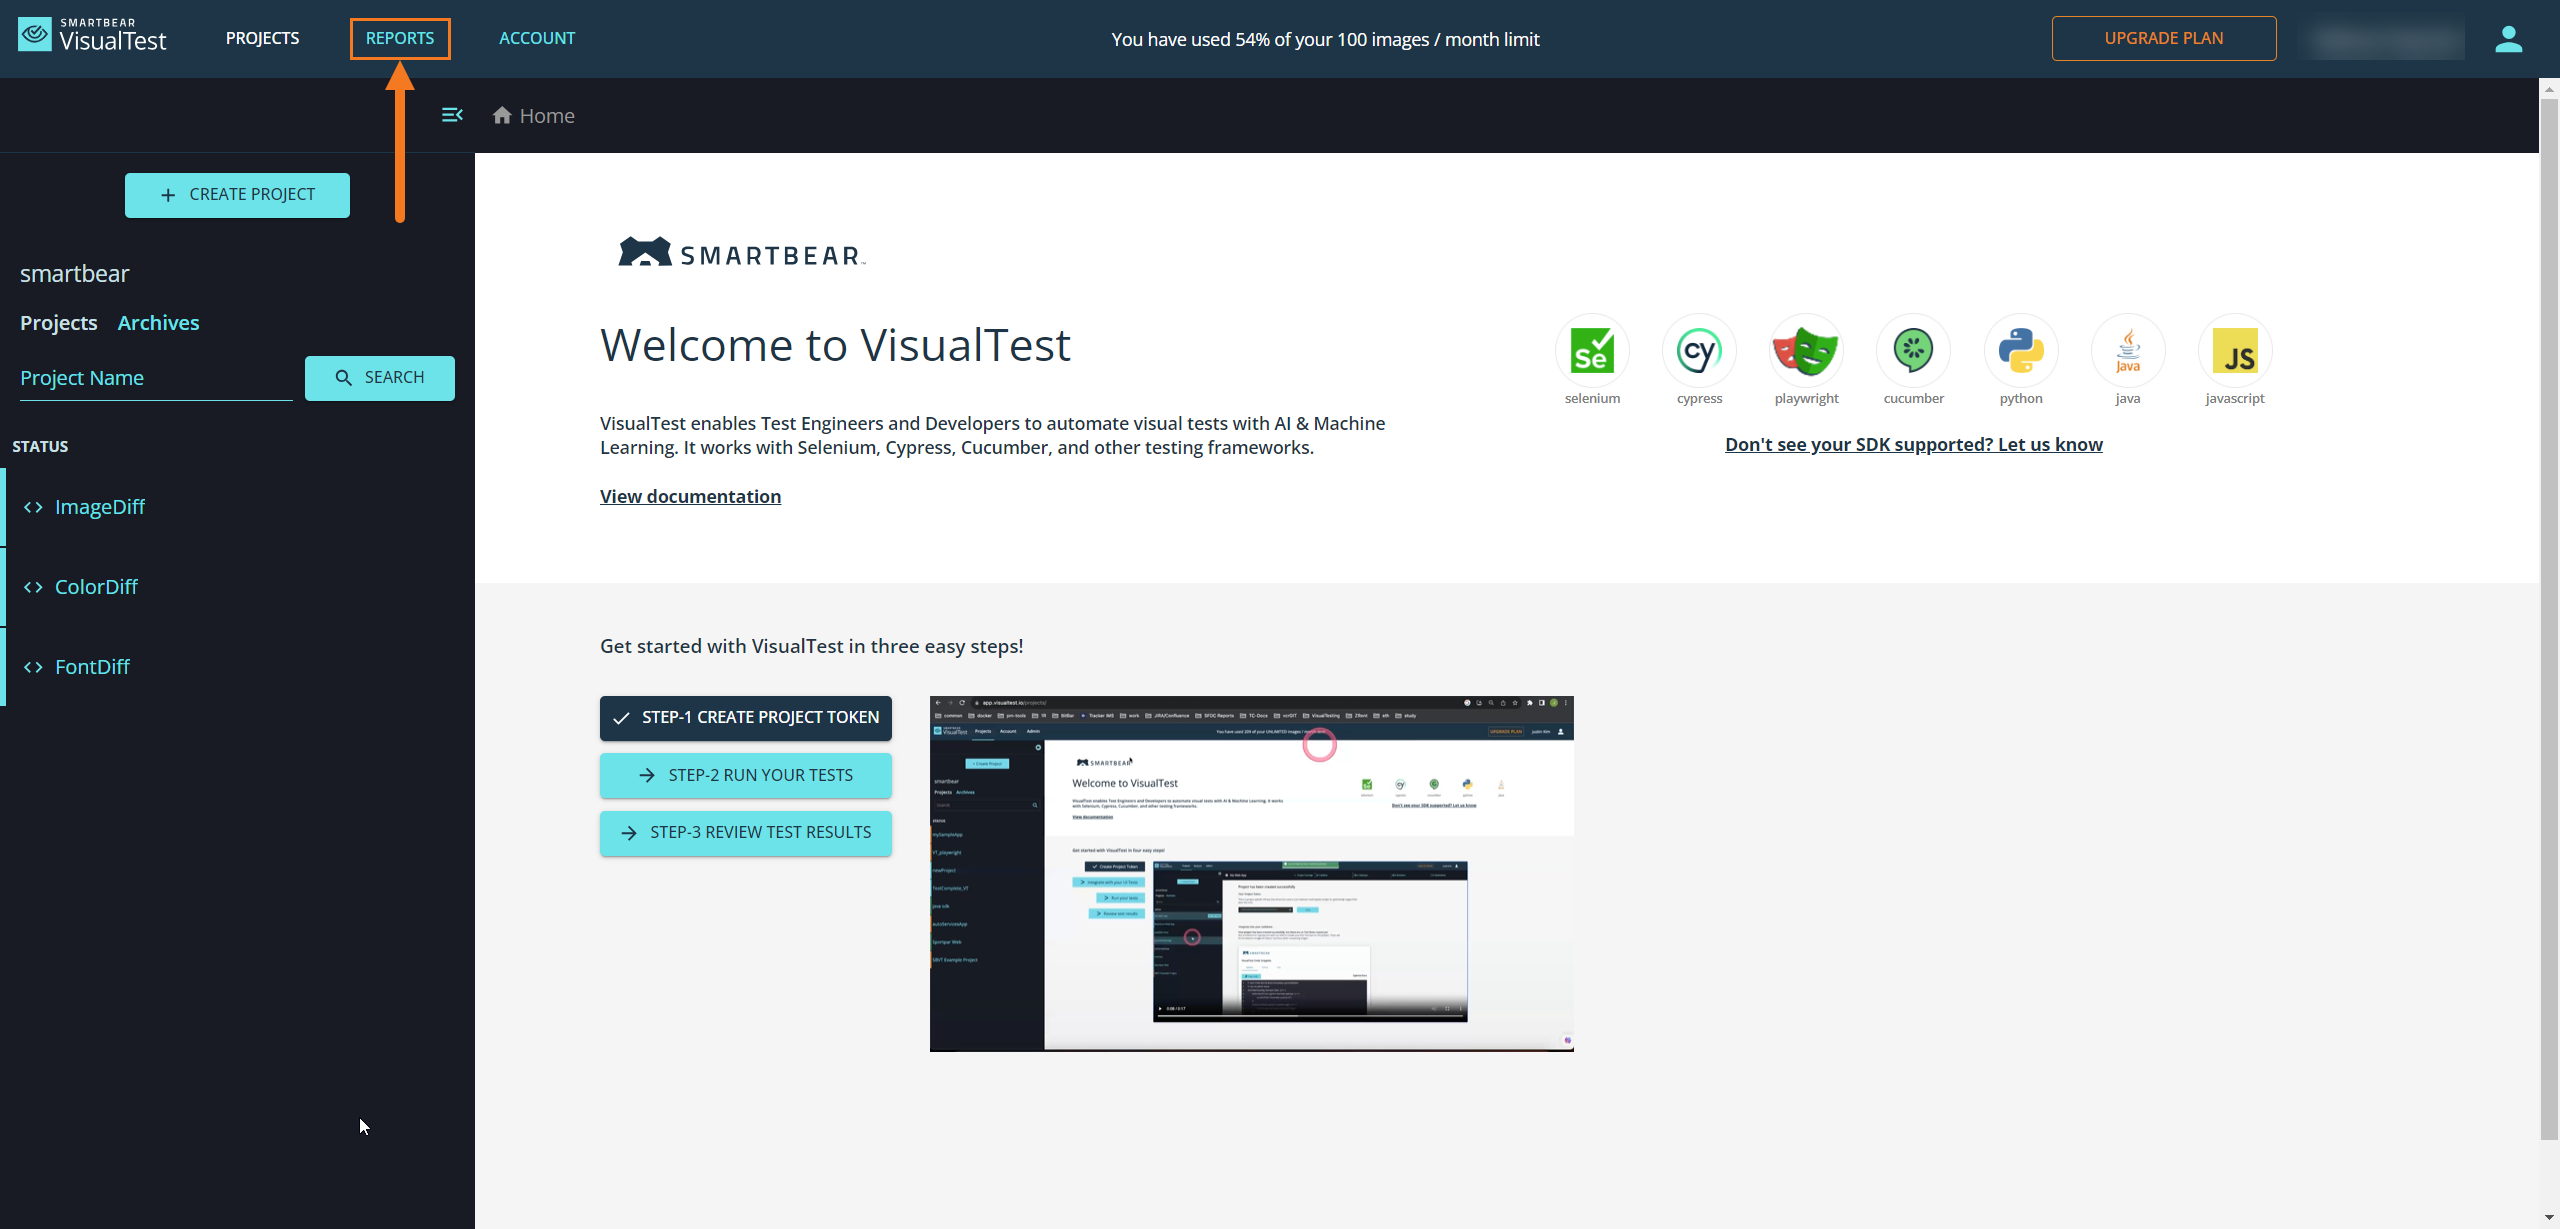
Reports
VisualTest allows you to keep track of the results of your test runs in the form of extensive reports. To open the Reports page, click Reports on the top bar.
 |
The Report Page consists of three main sections:
Filters
The Filters section allows you to filter your tests based on their details and/or date of execution. The results are displayed in the Overview section.
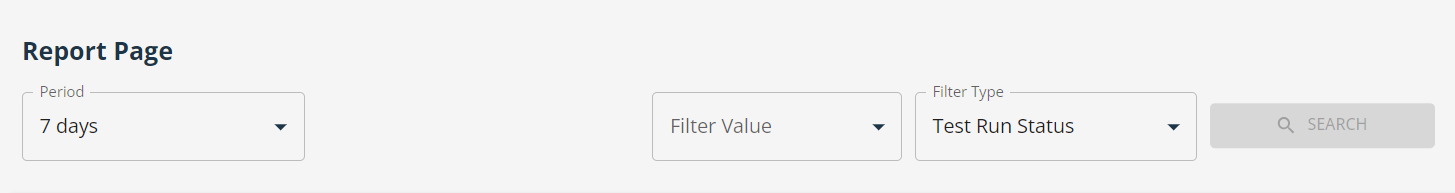 |
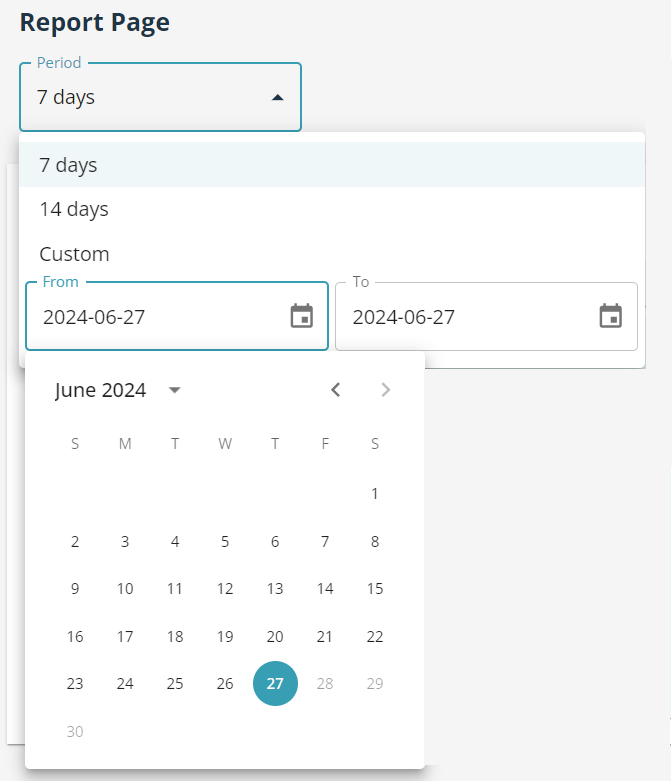
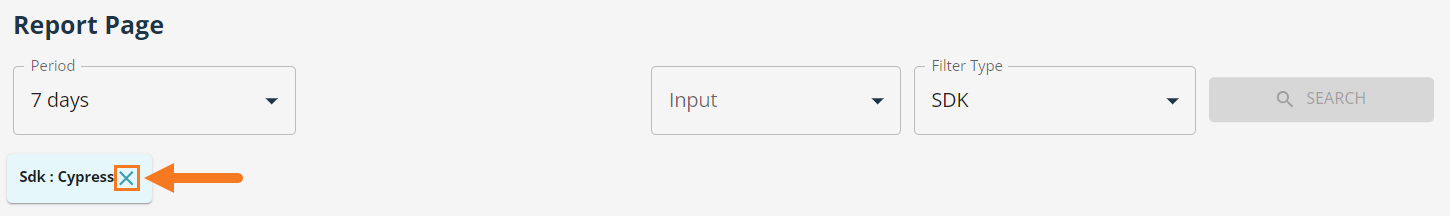
Click Period to select the time period from which you want to consider the tests. You can choose from 7 days, 14 days, or any period by selecting it from the drop-down calendar.
Click Filter Type to filter the test runs based on their details. Next, choose or type the selected value in the Input window. You can choose the filter types from the following:
Operating System – choose from the supported operating systems: Android, ChromeOS, iOS, Linux, MacOS, or Windows.
Project – choose from your projects.
Source Control Branch – enter your SCM branch name.
Source Control Commit – enter your SCM commit name.
SDK – choose from the supported Software Development Kits: Cypress, Java, JavaScript, Playwright, Python, or Manual-Screenshot.
Test Run Status – choose from the statuses of your test run: All-new-images, All-passed, Error, Reviewed, or Unreviewed.
Click Search to apply the filters. You can remove the filters by clicking next to the filter.
Overview
The Overview section displays the report data based on the applied filters, including the number of projects, test runs, and comparisons.
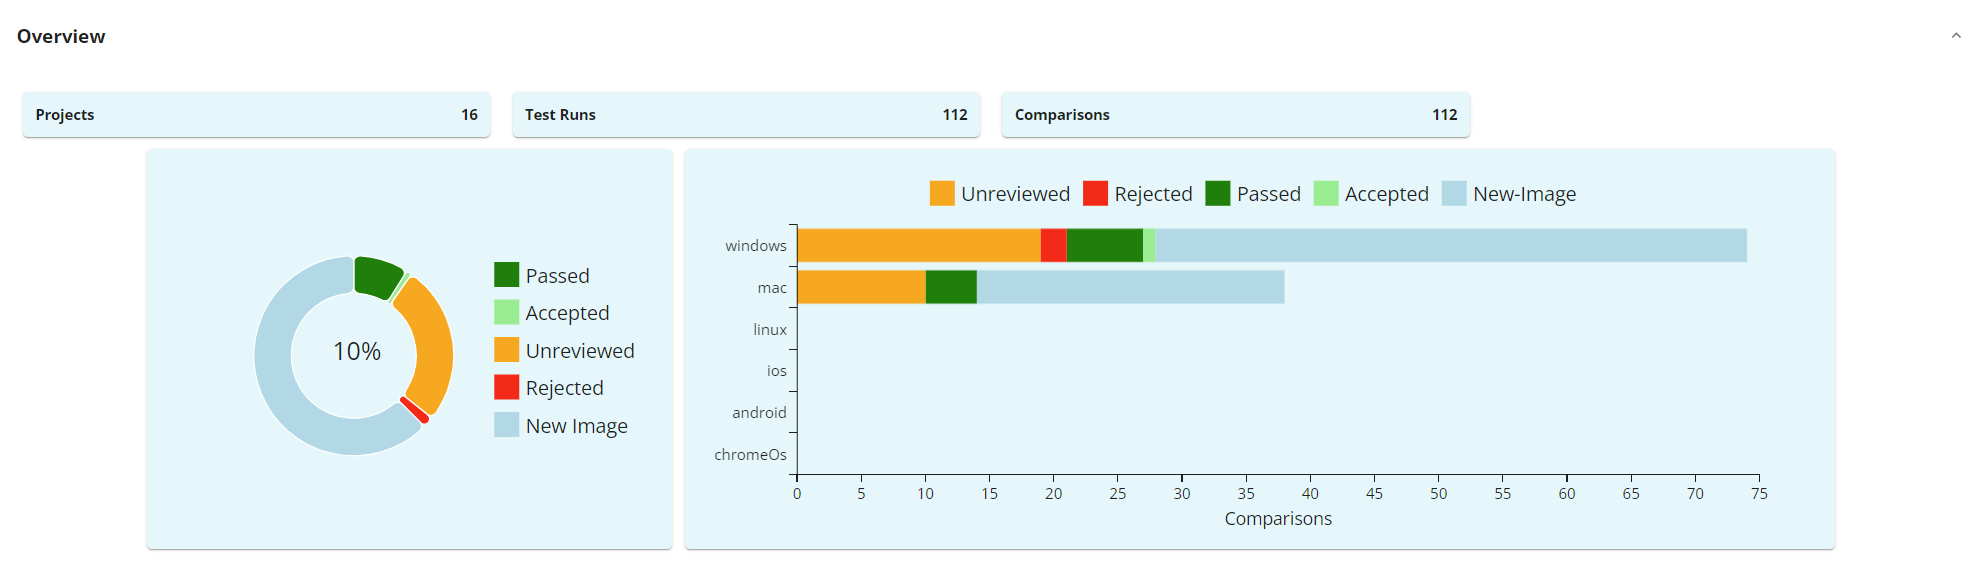 |
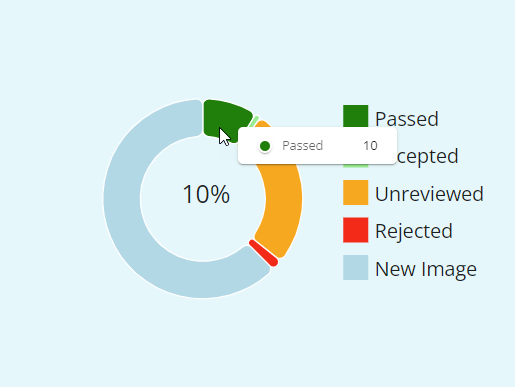
The pie chart displays all of the comparisons taken in the test runs and shows the percentage of the comparisons that were either Passed or Accepted. To see the number of comparisons of a given type, hover your mouse cursor over the comparison's color on the pie chart.
 |
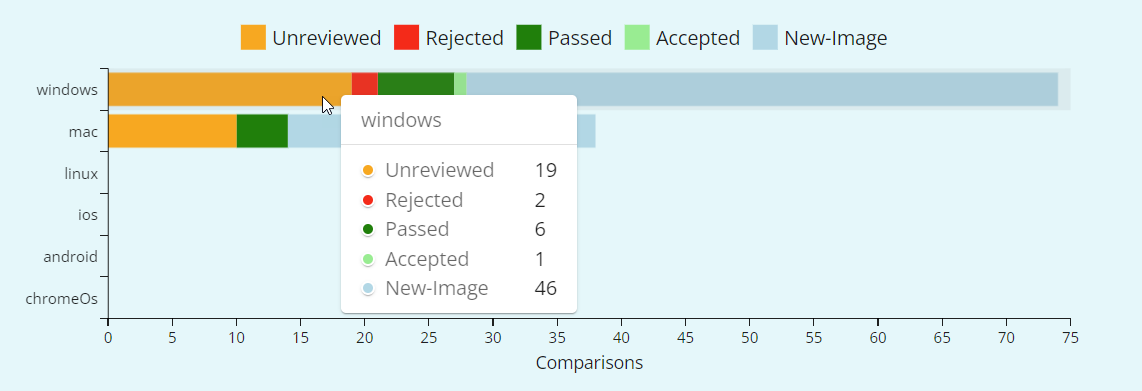
The bar chart shows the operating systems on the vertical axis and the number of comparisons on the horizontal axis. Here you can check the distribution of comparisons on a specific OS by hovering your mouse cursor over the selected bar.
 |
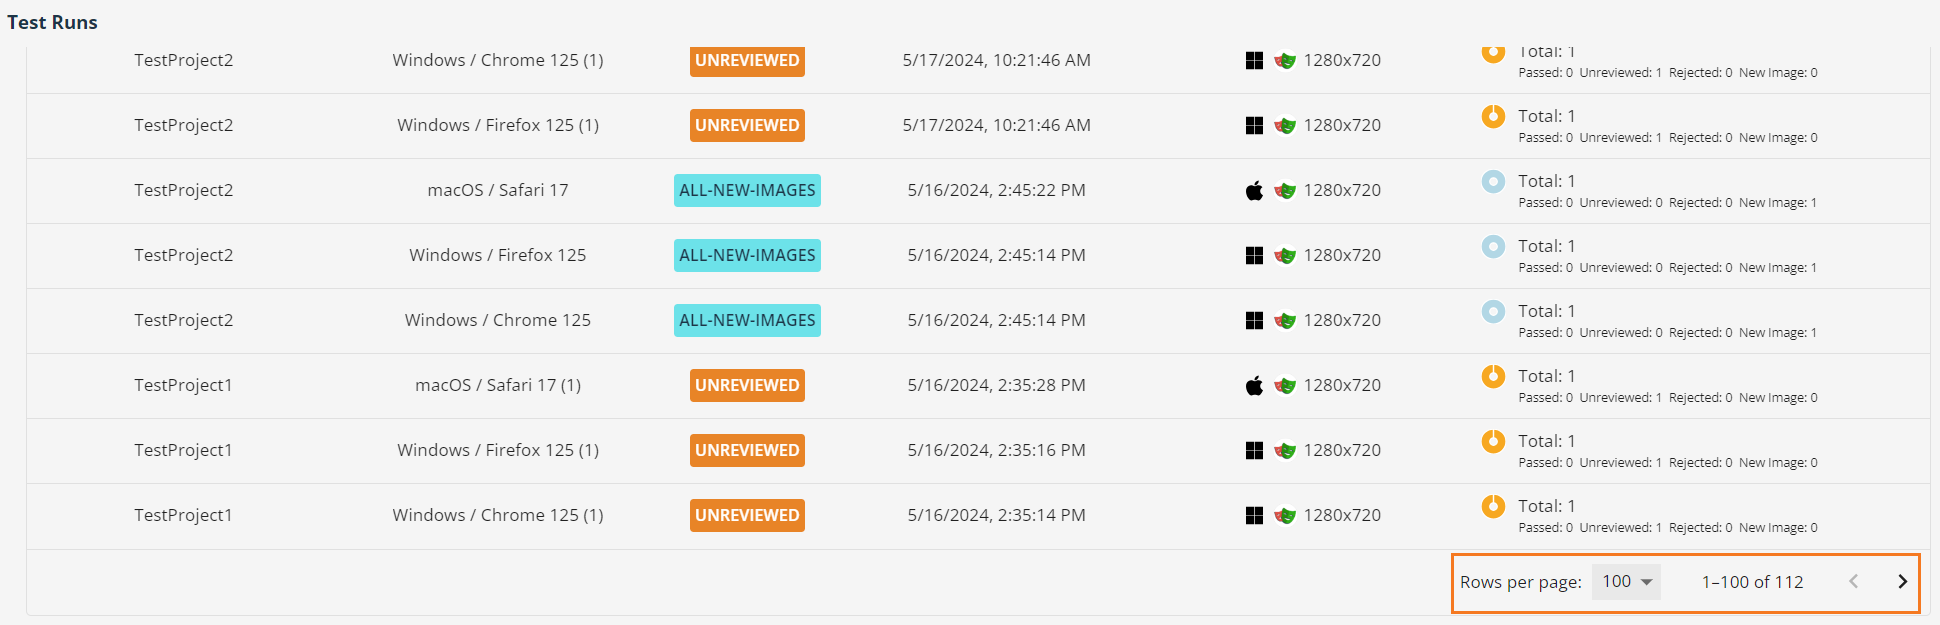
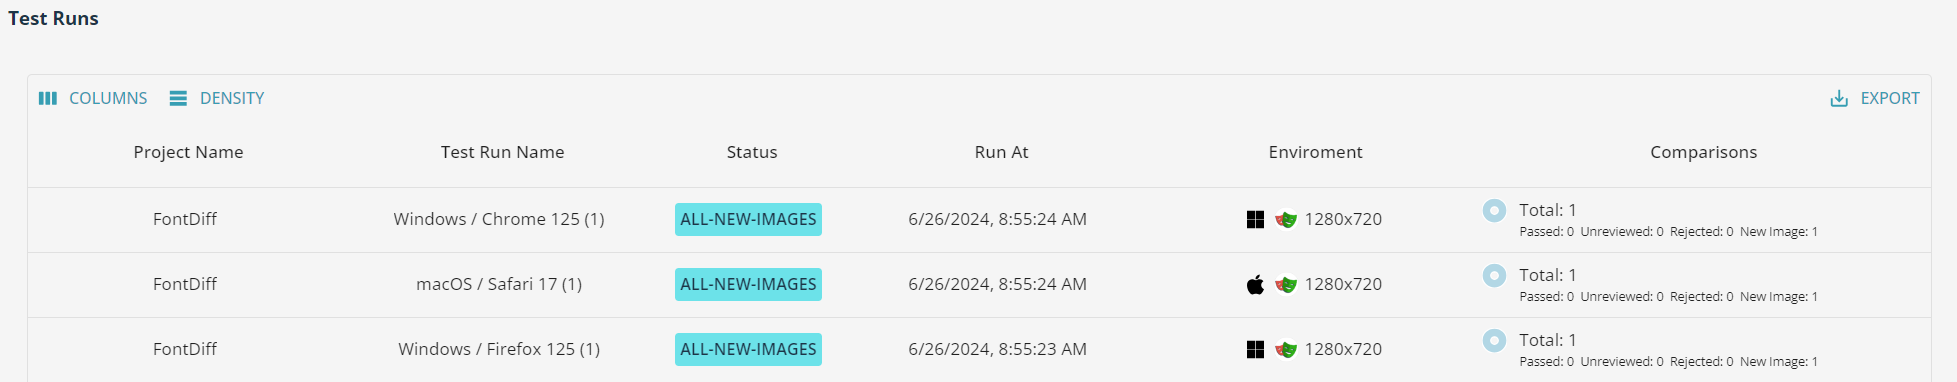
Test Runs
In the Test Runs section, you can see the details of the test runs based on the filters sorted into the following columns:
Project Name – displays the names of your projects.
Test Run Name – displays the names of your test runs.
Status – displays the statuses of your test runs (All-new-images, All-passed, Error, Reviewed, Unreviewed).
Run At – displays the date and time of your test runs.
Environment – displays your test run's operating system, SDK, and resolution.
Comparisons – displays the comparisons of your test runs (Passed, Unreviewed, Rejected, New Image). You can hover your mouse over the little pie chart to see the number of specific comparison statuses.
 |
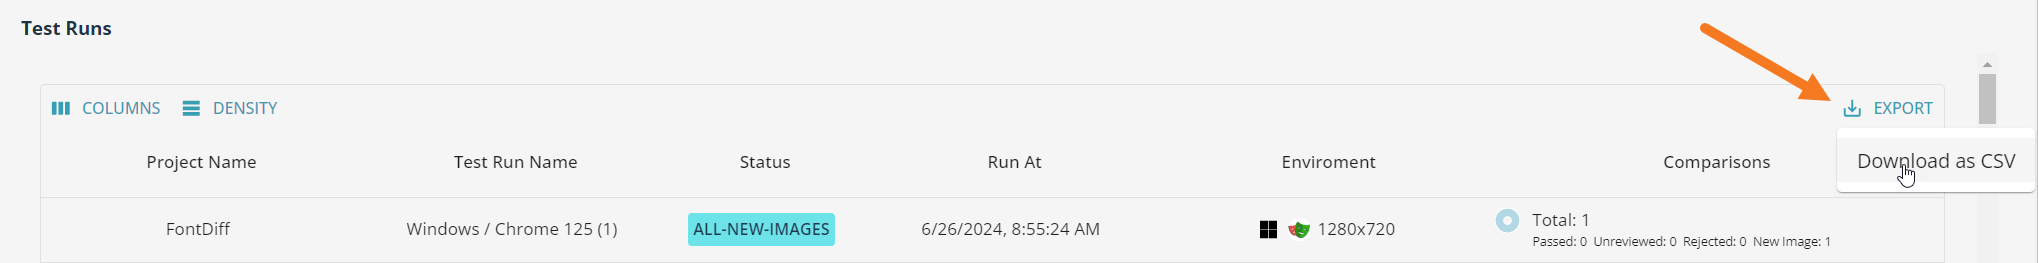
You can export the details of your test runs as CSV. To do that, click Export and then Download as CSV.
 |
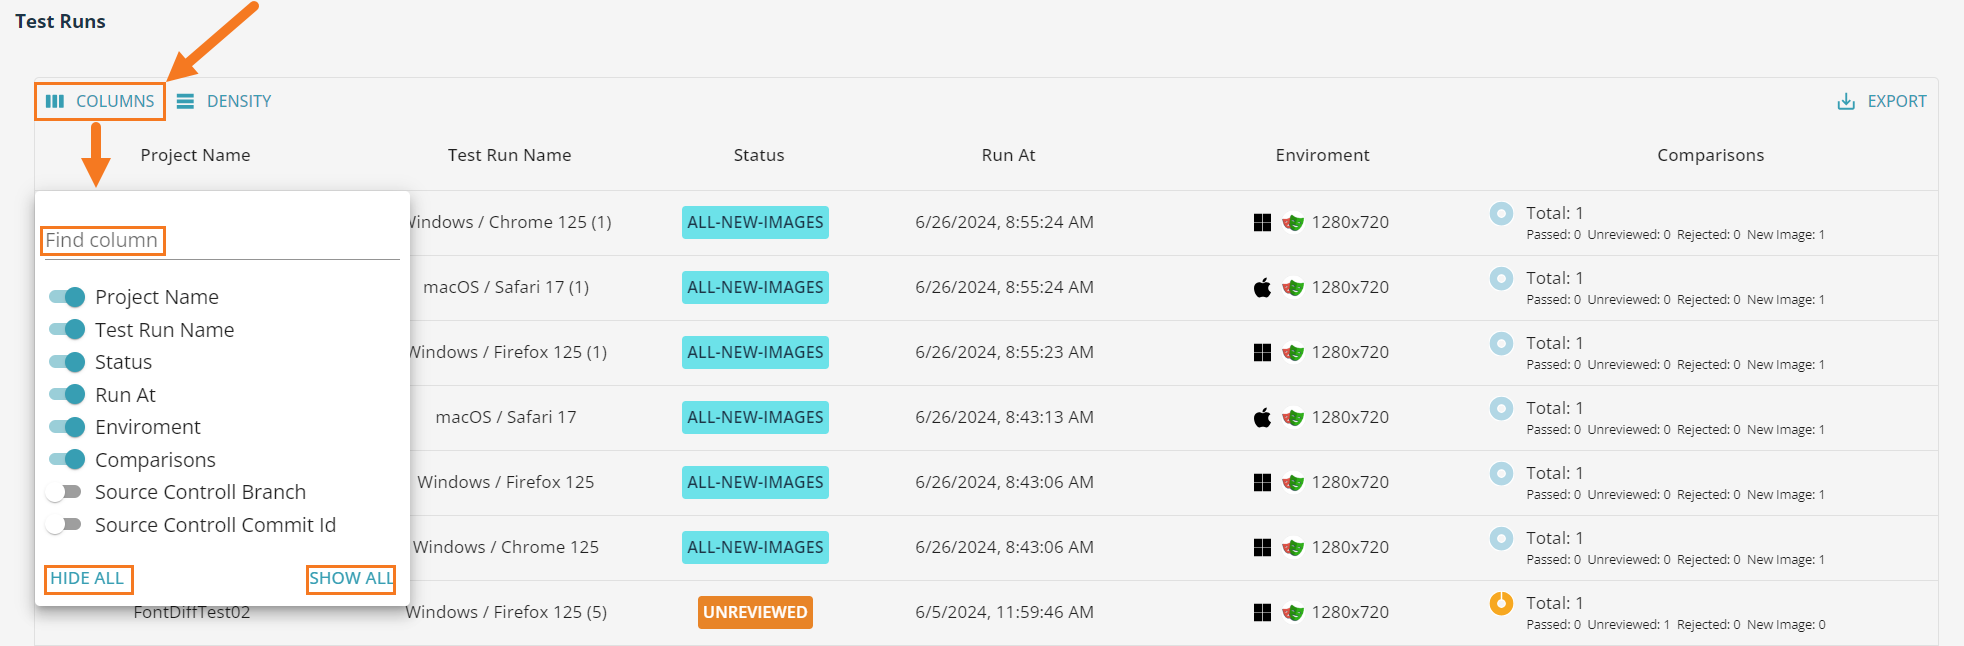
Test Runs Section Customization
You can customize the Test Runs section in the following ways:
Click Columns to toggle the visibility of selected columns on and off. You can also type the column's name and hide or show all of them.
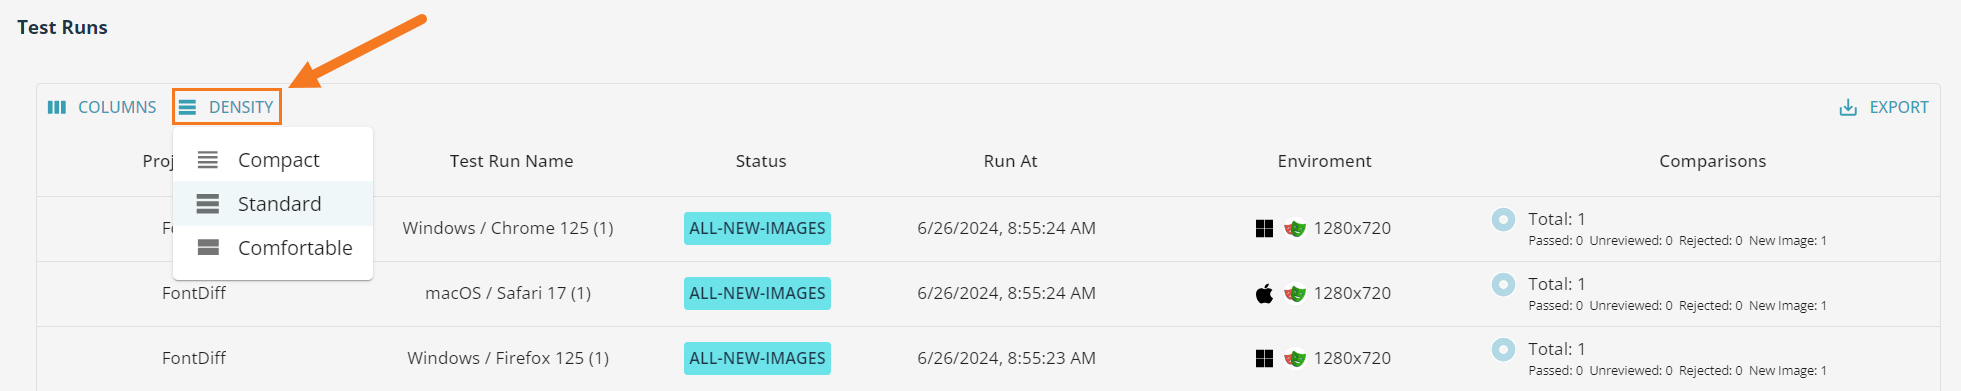
Click Density to change the density of the rows to Compact, Standard, or Comfortable.
Hover over the column's name to display the column sorting option. Set to sort ascending or to sort descending.

Click in the column to display its following additional options:
Sort by ASC – sort the column ascending.
Sort by DESC – sort the column descending.
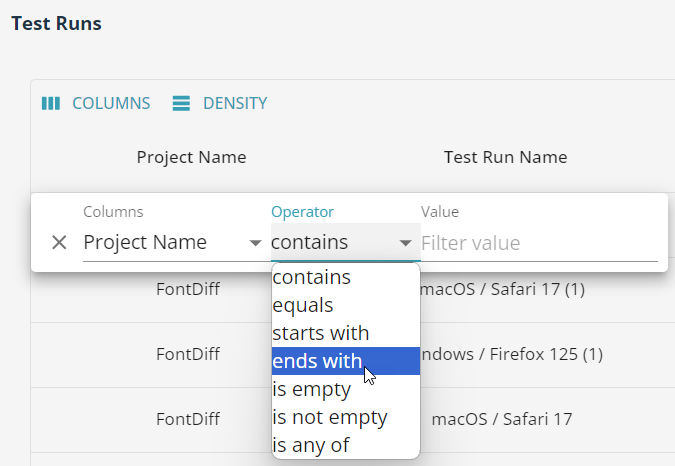
Filter – click to enable more filters in the column. Here you can search the columns using a phrase of your choice. Type the phrase of your choice in the Value cell, then select one of the Operators.
Hide column – hides the column.
Warning
If you hide a column using this button, you can only turn its visibility again by using the Columns button.
Manage columns – works the same as Columns.
Scroll down to the bottom of the section and click next to the Rows per page to choose the number of displayed rows (25, 50, 100) or click and to browse between the test runs pages.