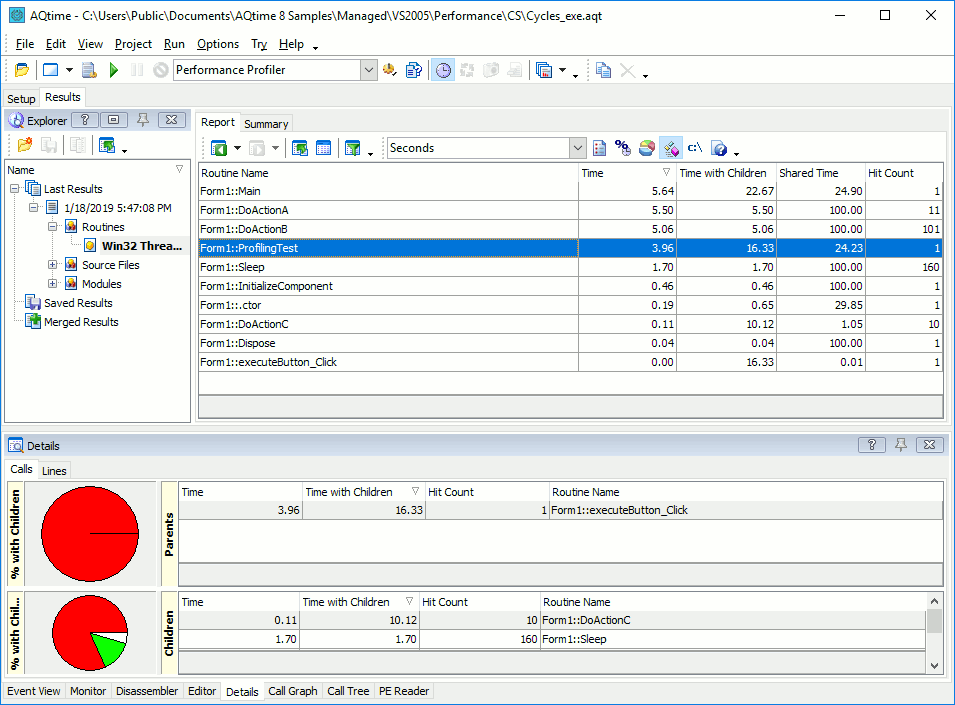
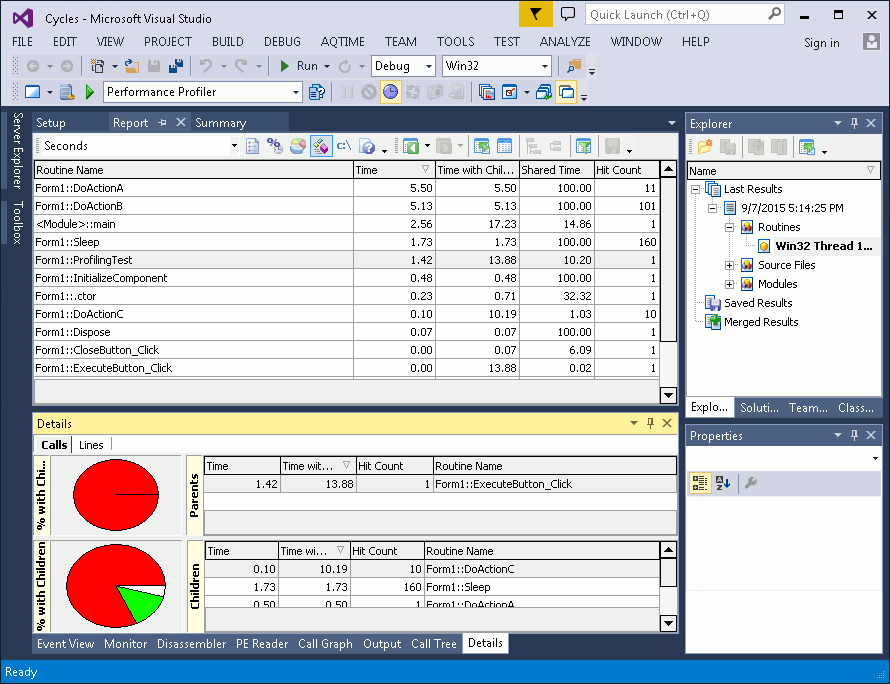
After profiling your application, AQTime displays profiling results in its panels:
Organization
A summary of profiling results is shown in the Summary panel. It helps you quickly find routines with poor performance and determine which code snippets of your application should be optimized.
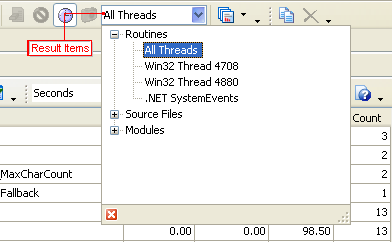
Most profilers organize results into categories. For instance, the results of the Allocation profiler are organized into the Classes and Objects categories. Within categories, AQTime stores profiling results for each thread (AQTime also stores results for the entire application). You can select the desired category and thread in the Explorer panel or from the Result Items box:

The Report panel shows results for the selected thread and category. The other panels display additional profiling results. The Report panel shows a table where each row corresponds to a routine, line, class, module or object that has been profiled. When you select a row, other panels are updated to display information for that routine or line (not all the panels apply to all profilers):
- The Call Graph panel displays the call information for the selected routine.
- The Call Tree panel displays all call "paths" for the routine.
- The Details panel holds additional profiling results for the routine, for instance, the call stack, "child" and "parent" routines, etc.
- The Editor panel displays the source code of the selected routine.
- The Disassembler panel displays the binary code of the selected routine.
- The Event View panel is unaffected; it simply logs events that occurred during the profile run.
Note that some AQTime panels hold footers that show summary values for data stored in panel columns. By default, the footer of a column displays the summary value that is calculated against all panel rows. However, if you select two or more rows in the panel, AQTime will recalculate the summary and the footer will display summary values for selected rows only.
Managing Results
- You can sort results by one or several columns.
- You can group results by one or several columns.
- You can search results using the Find dialog or the Incremental Search feature.
- You can add summary fields.
- You can filter results.
- Better yet, you can apply a result view from the many pre-defined ones, or from those you define yourself. A result view combines a filter, layout and settings of columns in AQTime panel and in the Editor's grid and layout of panes in the Details panel.
- Using the Explorer panel, you can compare current results with previous ones to find the effects of changes you made in the application (or in the way you ran it). In addition, you can merge several results to collect mass statistics. The Explorer panel lets you organize profiling results like files and folders in Windows Explorer.
Transferring Results
Profiling results can be:
- copied to the Clipboard,
- printed using the Print Preview Form,
- exported to text, Excel, html or xml formats (see Exporting Results).
More Usability Features
- While you use the Report or the Details panels, AQTime records your movements from item to item. You can come back to something you selected previously, and then return to where you jumped back from, as with an Internet browser. Use the
 Display Previous and
  Display Next buttons on the Report toolbar to do this. See AQTime Panels for more information.
 - AQTime's visual means for arranging grids apply to the display of results, of course. You can:
- change column width and ordering,
- hide or show columns (not all columns are displayed by default).
By default, this item is hidden. To add it:
-
Right-click any AQTime toolbar and select Customize from the context menu.
-
In the Customize dialog, open the Commands tab and select the Standard category.
-
Drag the Result Items command to the desired toolbar and then close the dialog.


