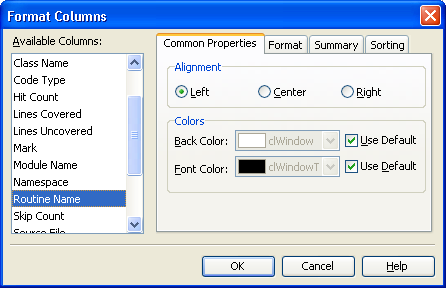
The Format Columns Dialog sets display parameters for columns in AQTime panels (Report, Details, Editor's grid, and others). There are settings for each column, and all columns can be set when the dialog is open. To open it, right-click on the header line and select Format Columns from the context menu:

The top-left listbox holds a list of columns, the rest of the dialog holds the settings for the column currently selected in the list. These settings are separated into the following tabbed pages:
- Common Properties
- Value alignment (left, right or center).
- Column background color (default or as selected from a colorbox).
- Font color (default or as selected from a colorbox).
- Format specifies the display format and customizable parameters for the given column.
For the numeric columns the available display formats are:
Format Description Parameters Value The measured result value. Format String - defines how the value is displayed. For more information about the format string specifiers for numerical values, see Syntax of the Format String. Percent The percent value calculated relative to the total for this column. Format String - defines how the value is displayed. For more information about the format string specifiers for numerical values, see Syntax of the Format String. Bar Graph A horizontal colored bar. The bar’s length is calculated relative to the total for this column. Bar Color - specifies the color of the bar (default or as selected from a colorbox) Color A colored square mark. The fill color ranges from Zero Color to Max Color and it’s tint indicates the current percentage value. Zero Color - a color that is to fill the values whose percentage is 0%. The default color is white. Max Color - a color that is used to fill the values whose percentage is 100%. The default color is red.
For string columns you can specify only the Format String. For more information about the format string specifiers for textual values, see Syntax of the Format String.
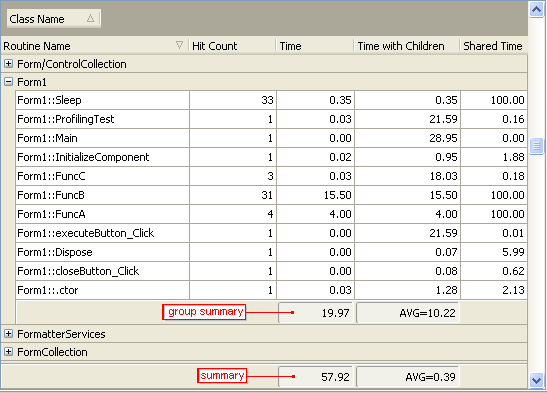
- Summary specifies the kind of summary field displayed at the bottom of the given column. Another case when the summary field can be displayed is when the results in the Report panel are grouped by one or more columns, the panel appears as a tree list. Each main branch occupies one line, which is not devoted to any single result, but acts as the group summary field.
If the summary and group summary fields are displayed, the values they hold will be a statistic (sum, average, minimum, maximum, count, and so forth.) calculated either from all the values or from the values of the group in the chosen column.
The Summary Kind section lets you choose how the summary and group summary are calculated (the group summary is calculated for each group when you group results by a column. The group summary is displayed at the end of each group node):
Summary Kind Description None No summary shown. Min Minimum value displayed in the column or in the group. Max Maximum value displayed in the column or in the group. Average Average value displayed in the column or in the group. Count Number of records (lines) displayed in the column or in the group. Sum The sum of all values displayed in the column or in the group. Each column of the Report or Details panel can have its own summary settings:

As you can see, the summary type for the Time With Children column is AVG while the summary type for the Time column is SUM (the word "SUM" is not displayed).
- The Sorting tabbed page specifies the sorting order for column values. You can sort results on a column by clicking the column caption (see Sorting Results). The Sorting page provides an alternative way for sorting results. If the Allow sorting box is not checked, the sorting on the selected column is disabled. That is, clicking the column caption will have no effect. If this box is checked, the sorting is enabled and you can select the desired sorting order (None, Ascending or Descending) on the Sorting page. None means results are not sorted on the column, but since the sorting is enabled, you can sort results on this column at any time by clicking the column caption.
