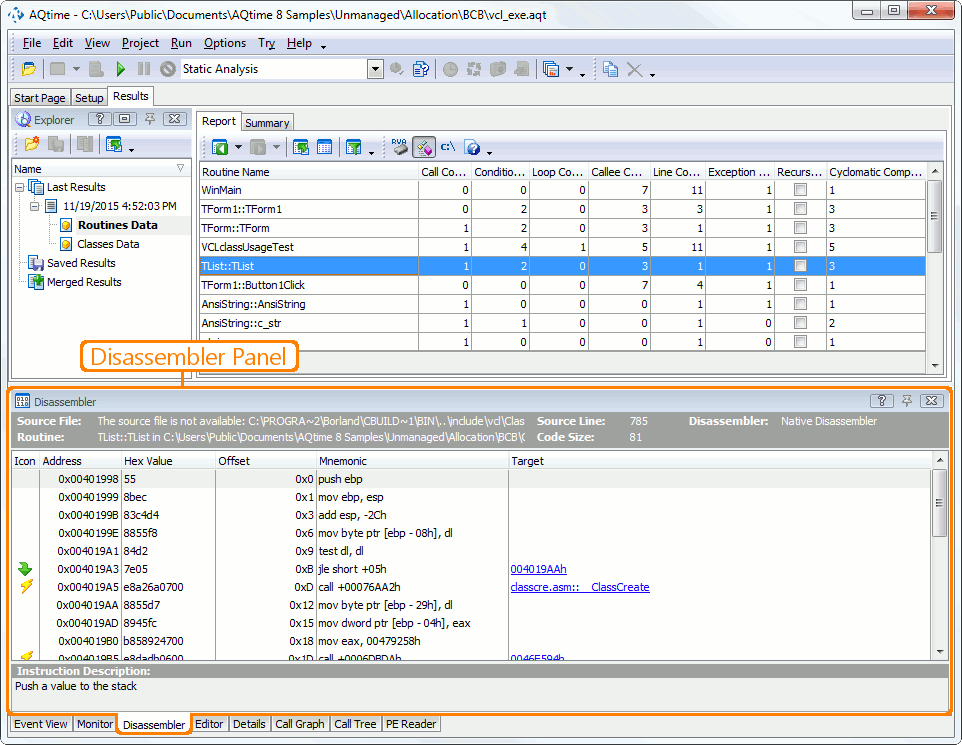
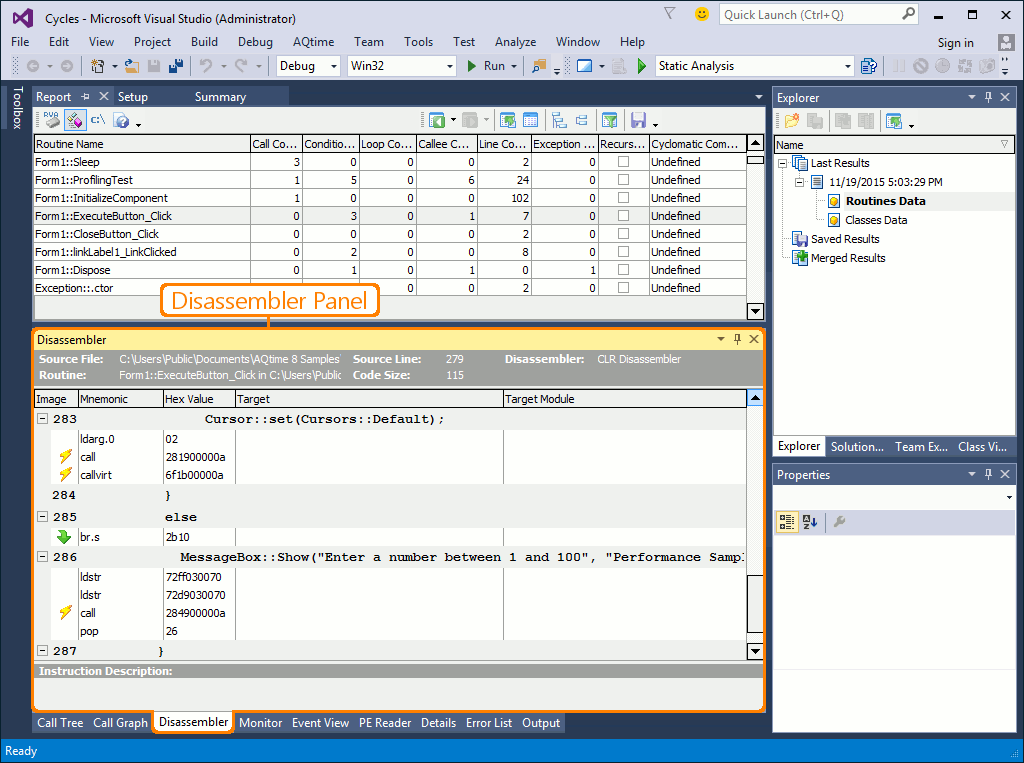
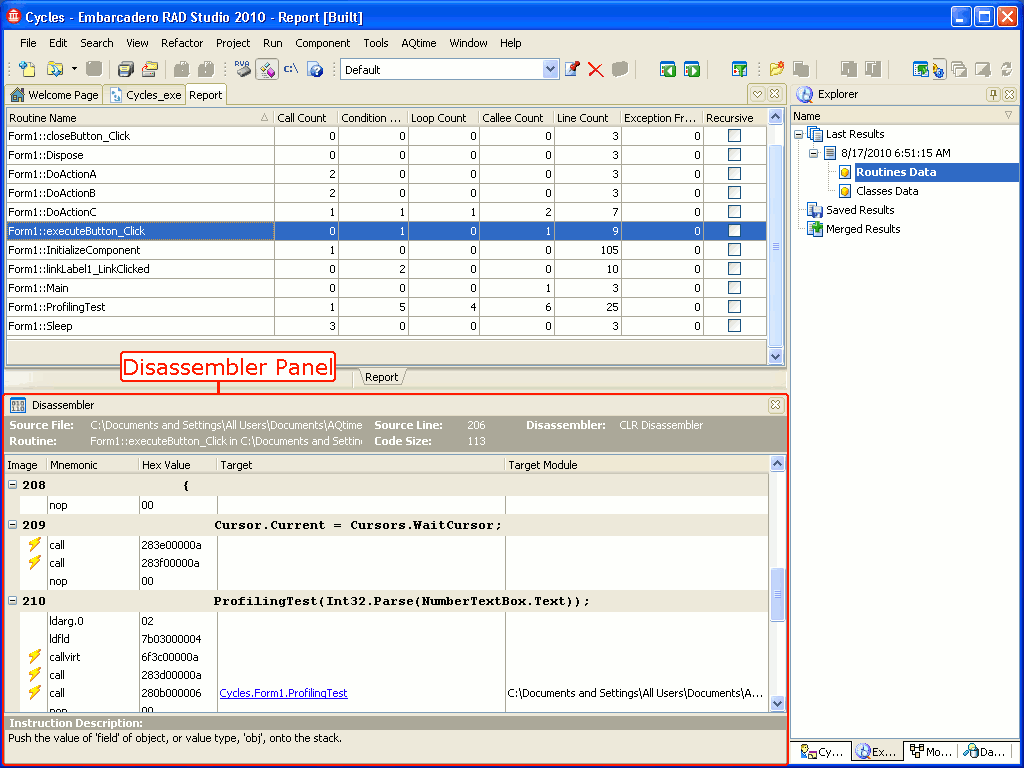
The purpose of the Disassembler panel is to allow you to check the binary code of your routines independent of the compiler, version or library behind this code. The Disassembler panel is updated when you double-click (click) on a routine in one of the AQTime panels: Report, Details, Event View, Setup, Call Graph, Call Tree, PE Reader or Summary. The panel can display the disassembly for both managed and unmanaged code.
To display the Disassembler panel, do any of the following:
- Select Disassembler from the View > Other Panels menu.
- Select Disassembler from the Select Panel dialog, which is called by selecting View > Select Panel.
- Select Disassembler from the Assistant panel.
- Select Disassembler from the Select Panel dialog, which is called by selecting AQTime > Panel List.
- Select Disassembler from Visual Studio's Solution Explorer.
- Select Disassembler from the Assistant panel.
- Select Disassembler from the View > AQTime Profile Windows > Other menu.
- Select Disassembler from the Assistant panel.
Here is a sample view of the Disassembler panel:
What Information the Disassembler Panel Displays
The Disassembler panel displays the binary code for the routine that is selected in the Report or Summary in assembly language, showing either the source code with its line-by-line disassembly, or plain disassembly from the binary code in memory.
For detailed description on data displayed in the Disassembler panel, see the Disassembler Panel Contents topic.
Information on the Disassembler Panel
| To learn more about … | See these topics … |
|---|---|
| Data displayed in the panel | Disassembler Panel Contents |
| Working with the data displayed in the panel | Working With the Disassembler Panel |
| Panel's settings | Disassembler Panel Settings |
| Panel’s context menu | Disassembler Panel Context Menu |
See Also
Disassembler Panel
Disassembler Panel Options
Analyzing Profiler Results
Exporting Results


