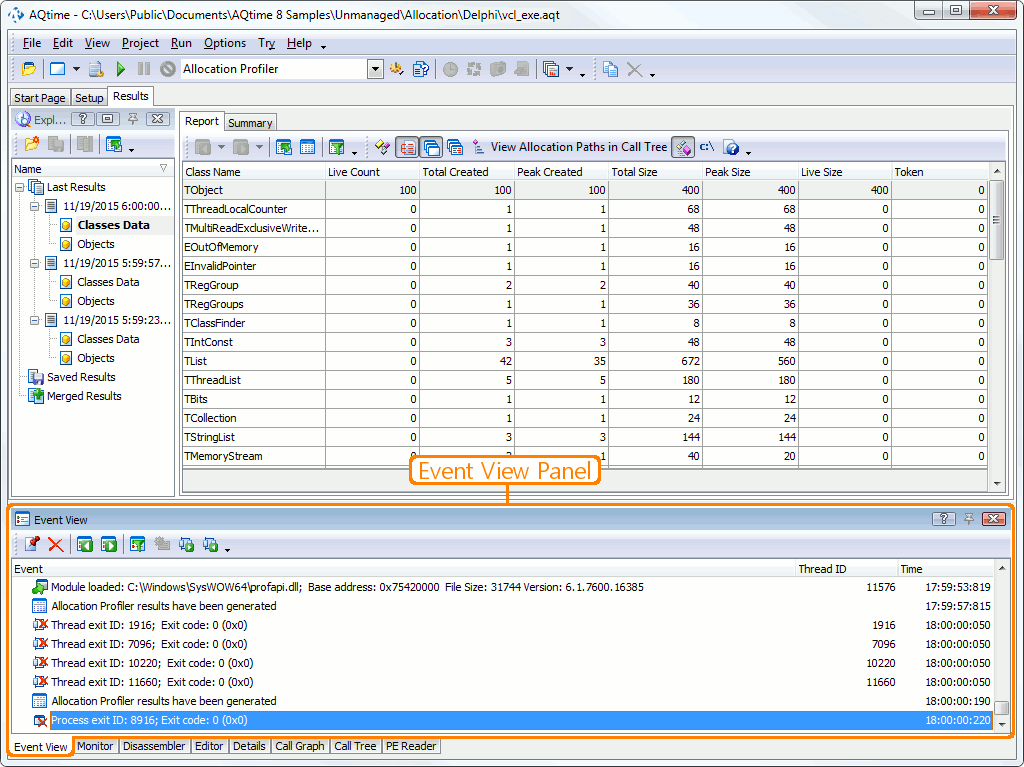
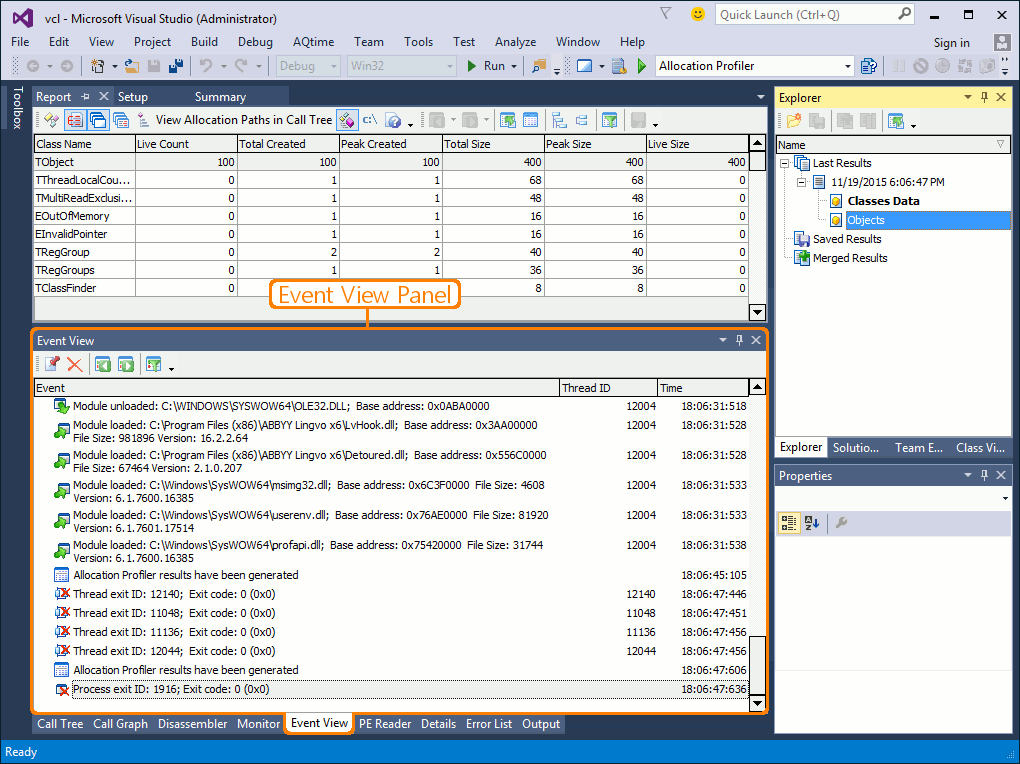
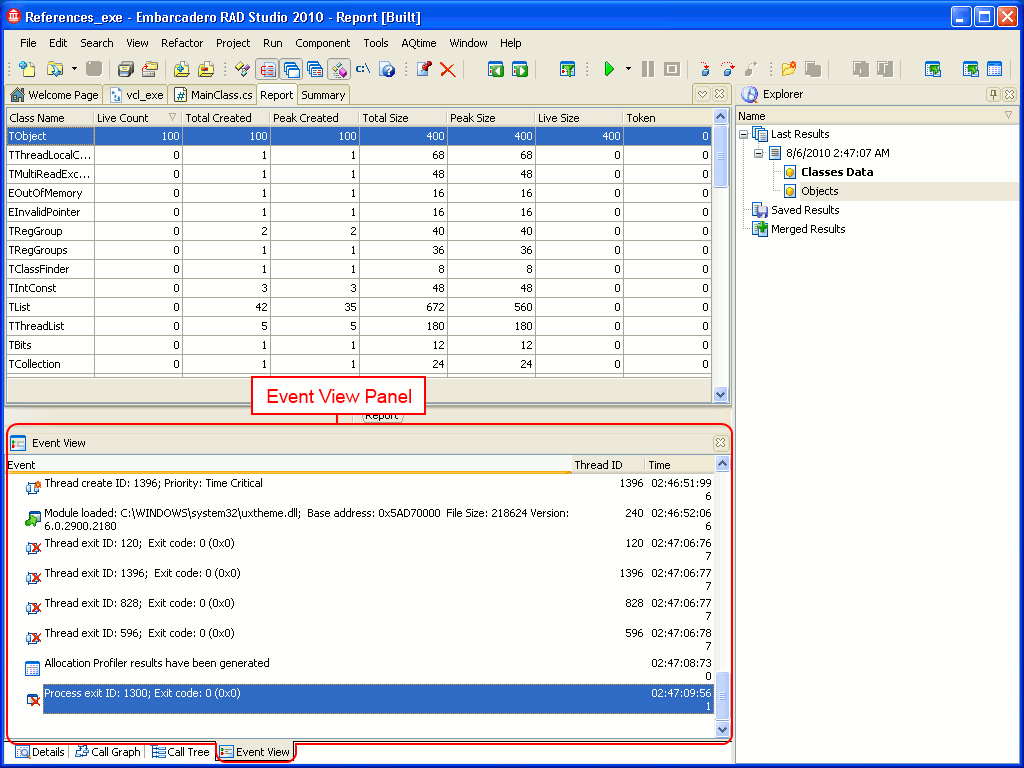
The Event View panel displays events that occur within AQTime and the profiled application during the profiling. Each event is displayed as a parent node. Some events have child nodes that provide you with additional information about the event.
To display the Event View panel, do any of the following:
-
Select Event View from the View > Other Panels menu.
-
Select Event View from the Select Panel dialog which is called by selecting View > Select Panel.
-
Select Event View from the Assistant panel.
-
Select Event View from the Select Panel dialog which is called by selecting AQTime > Panel List.
-
Select Event View from Visual Studio's Solution Explorer.
-
Select Event View from the Assistant panel.
-
Select Event View from the View > AQTime Profile Windows > Other menu.
-
Select Event View from the Assistant panel.
The following image displays the overall view of the Event View panel:
What Information the Event View Panel Displays
During the profiling session the Event View panel displays events that occur with AQTime and the application under profiling. The Event View panel has three columns:
| Column | Description |
| Event | The event description. For the list of events that are traced during the profiling, see Event View Panel Events List |
| Thread ID | The identifier of the thread where the given event occurred. |
| Time | The time when the event occurred. If the Time from application start option is enabled, Time is counted from the beginning of the current profile run. Otherwise, it is the system time. |
You can enable and disable monitoring events during the profiling. For more information, see Working With the Event View Panel.
Information On the Event View Panel
| To learn more about... | See these topics... |
| Working with data displayed in the panel | Working With the Event View Panel |
| Panel's settings | Event View Panel Settings |
| Panel's context menu | Event View Panel Context Menu |
You can customize the layout of the Details panel the same way you customize any other AQTime panel. For example, you can change the Details panel’s size, position and docking, hide the panel or make it visible. To learn how to customize the interface, see Working With Panels.
Additional Information on Tracing Events
| For information on... | See... |
| Tracing exceptions | Exceptions in the Event View Panel |
| Adding custom messages to the panel | Adding Custom Messages to the Event View Panel |
| Possible problems with call stack | Possible Problems with the Call Stack |
See Also
Event View Panel
Event View Panel Settings
Analyzing Profiler Results


