When using AQTime --
-
First you define a profiling project, which will likely involve many profile runs over several days or months.
-
Then, for each profile run --
- you first define what you wish to profile, ...
- then execute the profile run, ...
- which generates results when the application exits or when you ask for this through Run > Get ResultsAQTime > Get ResultsAQTime > Get Results.
- Once you have the new results --
- you can browse through them ...
- or examine them in specific, targeted ways.
-
This result set is automatically added to the collected result sets for the project, and then or later --
- you can manage the collection, ...
- examine stored results with all the tools available for new results, ...
- and compare the result sets.
You will spend most of your time in AQTime working in its panels. The panels are organized to support the task list above. Of all the tasks above, only the first, defining a project is done outside a panel.
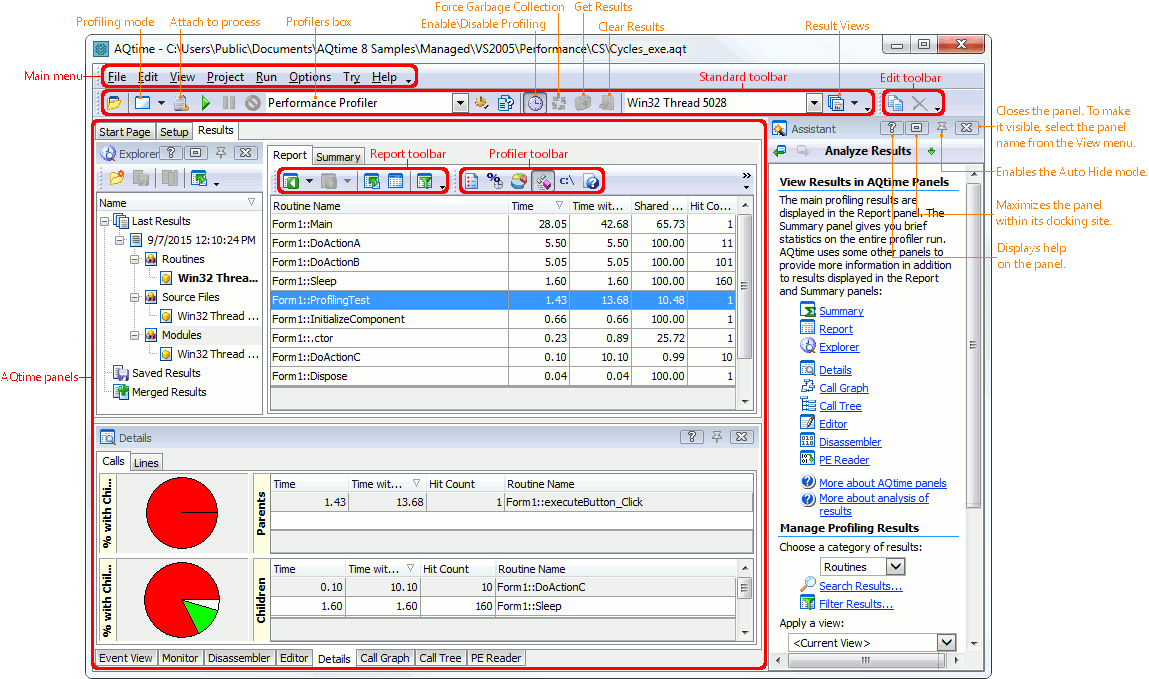
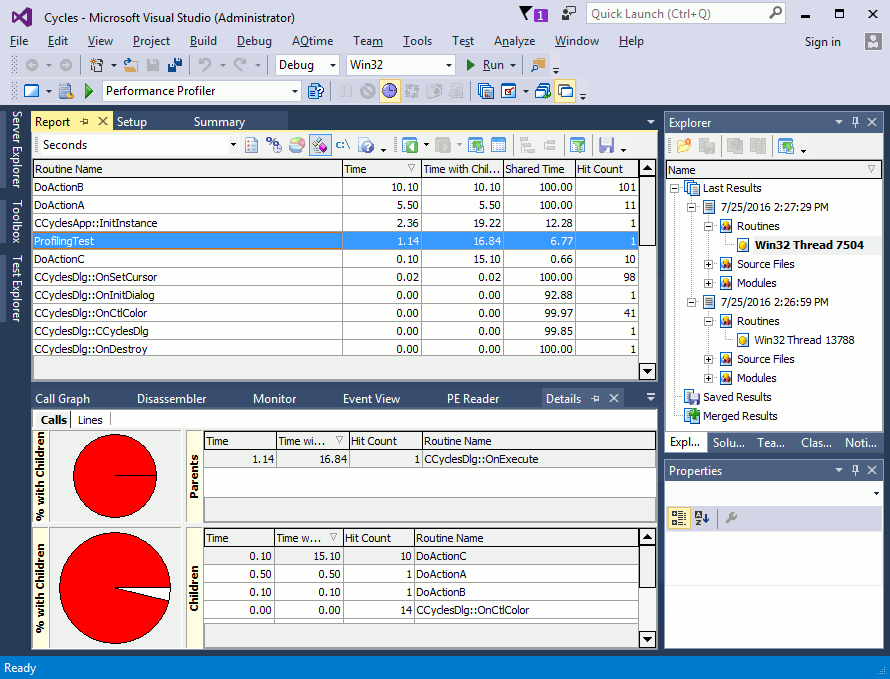
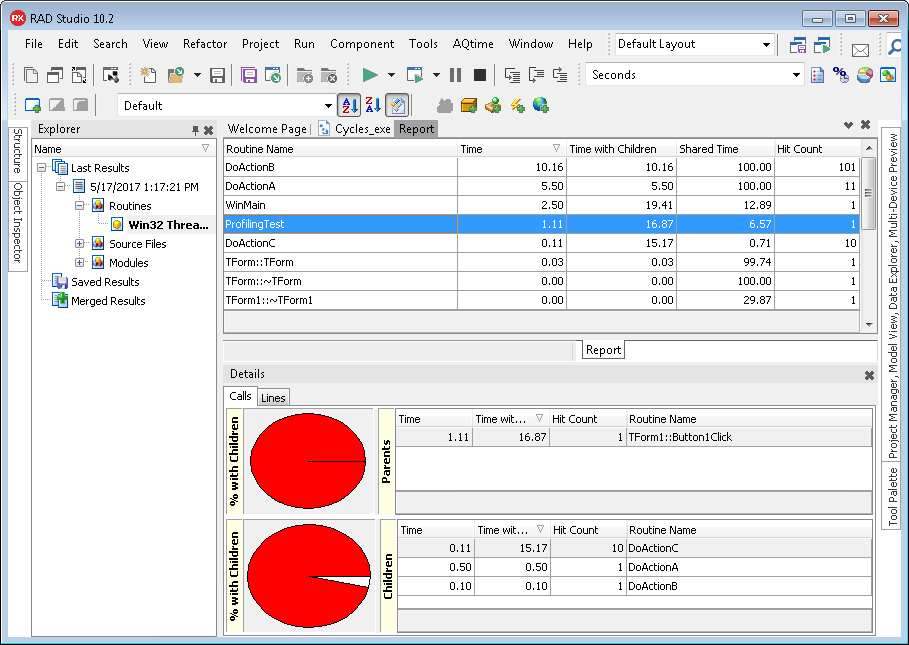
In the following picture, the latest result set from the Explorer panel is being browsed through in the Report panel. Extensive details, for the line currently selected in the Report panel, are displayed below in the Details panel.
There are four major panels. They closely follow the task list above:
| Panel | Description |
|---|---|
|
This is where you go before a profile run to define what it will profile and when, once you have selected which profiler to use from the Profiler dropdown list. |
|
|
This reports messages and events during profiling as they occur. In other words, this is where you track the ongoing profile run. |
|
|
After your results are generated, they are displayed here, and you can browse through them. If the profiled application used threads, the Thread dropdown list will allow you choose any single thread to display the results for, or all threads. There are also ways to filter the results and to organize the display in the panel. You can save a particular format for the panel and the filters as a result view. |
|
|
This is where you manage result sets from the current project, including the latest. Normally, the sets displayed are only those for the currently selected profiler, but you can also choose to have all the collections (one per profiler) presented in a tree view. Any result set can be selected and displayed in the Report panel. You can add a description to each set, and you can store it, retrieve it, compare it to others, save it to a separate file or read it from one. You can organize the entire collection through folders, and you can delete sets from it. Results in each single result set are organized into several categories in the Explorer panel. For instance, on the picture above, results of the Performance profiler are shown per thread. The categories depend on the profiler in use, for example, categories used by the Performance profiler differ from the Allocation profiler categories. |
Six more panels act as extensions to the Report panel, providing various types of information about the line currently selected in the Report panel, or about global results:
| Panel | Description |
|---|---|
|
AQTime profilers use this panel to provide additional information for a selected row in the Report panel, which would be impossible to show within reasonable space as additional columns in the Report panel itself. |
|
|
This panel shows the callers for the routine selected in Report, and which routines it called in turn, with statistics for each link. The call hierarchy can be browsed up or down by double-clicking on any parent or child, without returning to Report. |
|
|
This panel includes two tabbed pages showing execution paths for the routine selected in the Report panel. One of the pages, Parents, displays all stacks of function calls that led to the call to the selected routine. Another page, Children, displays all function calls that were initiated by the selected routine. Both panels highlight the "longest" path (for example, the path that took most time to execute) to help you find bottlenecks faster. |
|
|
Displays the source code for the line selected in Report (if available), along with optional summary results. This panel is only available if AQTime is running as a standalone application. If AQTime is running as a package within Microsoft Visual Studio, Visual Studio's native Code Editor is used instead of AQTime's Editor. If AQTime is running as a package within Embarcadero RAD Studio, Embarcadero RAD Studio's native Editor is used instead of AQTime's Editor. |
|
| Summary | This panel holds a summary of the profiling results. The contents of the panel depend on the current profiler. Use it to quickly find routines and classes that need to be optimized. |
| Disassembler | Displays the binary code for the routine that is selected in the Report, Details, Event View, Call Graph, Call Tree, Setup or Summary panels, in assembly language, showing either the source code with its line-by-line disassembly, or plain disassembly from the binary code in memory. |
AQTime includes three more panels: Assistant, PE Reader and Monitor:
| Panel | Description |
|---|---|
| Assistant | This panel helps you get started using AQTime quickly. Depending on which step you are currently at in your project, it displays information that helps you use all the power that AQTime's features can provide at this step. This panel can even be helpful to AQTime-gurus, since it provides faster access to AQTime features. |
| PE Reader | The PE Reader panel provides information about executables used by the main module of your AQTime project. It lets you easily see which modules are linked to your application at load-time and thus determine the modules that are necessary for your application to function properly. PE Reader provides information about module versions, imported and exported routines, etc. |
| Monitor | The Monitor panel is used along with the Allocation profiler. It traces memory allocations in real time and displays the size of allocated memory blocks, the number of existing object instances, etc. during the application run. It is very easy to use and quite instructive at times. |
AQTime keeps information about your browsing in its panels, just as a Web browser would. There are the  Display Previous and
  Display Next buttons on the Report toolbar, and you can use them to move back and forth among a sequence of routines that you are focusing on.
Most AQTime panels hold tables of data. You can customize them as you wish: change the column size and place, add and remove columns, sort and group records, etc. See Arranging Columns and Lines. Exactly what each panel displays is configurable through Options > Panel Options from the main menu. There are separate options for each panel.
Each panel can be undocked and moved to any other location. The View > Desktop > Docking Allowed menu item specifies if the docking is active or not. If this option is on, you can undock any panel by dragging its header. You can then drag this panel to another location, for example, you can put it on a tabbed page along with another panel. See Docking for complete description of the docking mechanism. If you ever need to bring up a panel quickly, the View menu was made specifically for that reason - it's your failsafe panel retriever.
AQTime panels are fully integrated into Visual Studio's IDE. You can dock, undock and move them around just as you would any other Visual Studio window. To bring up a panel quickly, simply select it in the Solution Explorer. You can also bring up a panel by selecting AQTime > Panel List from Visual Studio's menu and choosing the panel name in the ensuing dialog.
Note that when you start profiling, AQTime hides panels visible at design time and shows panels visible at profile time. After the profiling is over, AQTime hides the profile-time panels and displays design-time panels. Both profile-time and design-time collections of panels can be changed at your desire. If a panel is visible when profiling starts, it is automatically added to the design-time panel collection. If you make a panel visible at profile time and this panel is visible when profiling completes, it will be automatically added to the profile-time panel collection.
The AQTime > Toggle Panels menu item lets you quickly hide or display AQTime panels. If there are visible AQTime panels, then pressing this item will hide them. If there are no visible AQTime panels, pressing this item will show the panels that were visible at the moment of hiding.
AQTime panels are fully integrated into Embarcadero RAD Studio's IDE. To bring up a panel quickly, simply select it in the View > AQTime Profile Windows menu.
Most panels of AQTime have toolbars associated with them. The toolbar items are used to perform certain operations on data that are displayed in the panel. For instance, the  Field Chooser item on the Report toolbar displays a list of available columns allowing you to add a column to the panel by dragging it from this list to the panel. You can dock a toolbar to any side of the panel, to which this toolbar belongs. For more information on toolbars, see Toolbars Customization.


