Grouping results means getting all results (records) that share a single value for one field (for example, Class), to show on a single line in the Report panel. The column you choose to group results on becomes a synopsis of the entire result set (for instance, results grouped by class), shown in tree fashion, and the individual records are available by opening up the appropriate branch. This simplifies onscreen navigation of the Report panel when there are several records to show.
This is one reason all of the profilers include fields (for example, Source file, Class name, and so on) that help locate a profiled function in source code. For instance, when you group results on the Source file column, each grouped tree node corresponds to a separate source file. Try it!
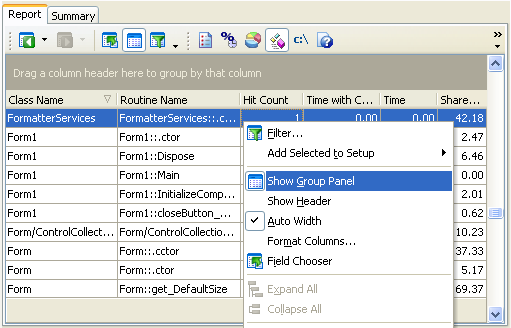
You can apply grouping simply by choosing Group by This Column from the context menu for the column header. However, for better control, and especially to undo grouping, you should choose  Show Group Panel from the Report toolbar or from the context menu anywhere in the panel. This opens the grouping area:

To group results on a column, drag the column header to the grouping area. To ungroup results, drag the column header out of this area.
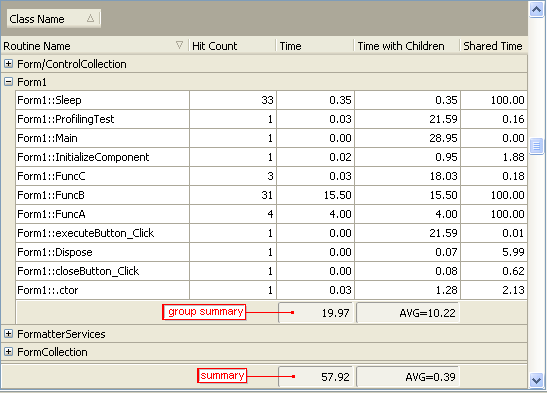
You can group on more than one column. Note that in addition to the "global" summary that is shown at the bottom of the Report panel, AQTime displays "group" summary at the bottom of each group:

