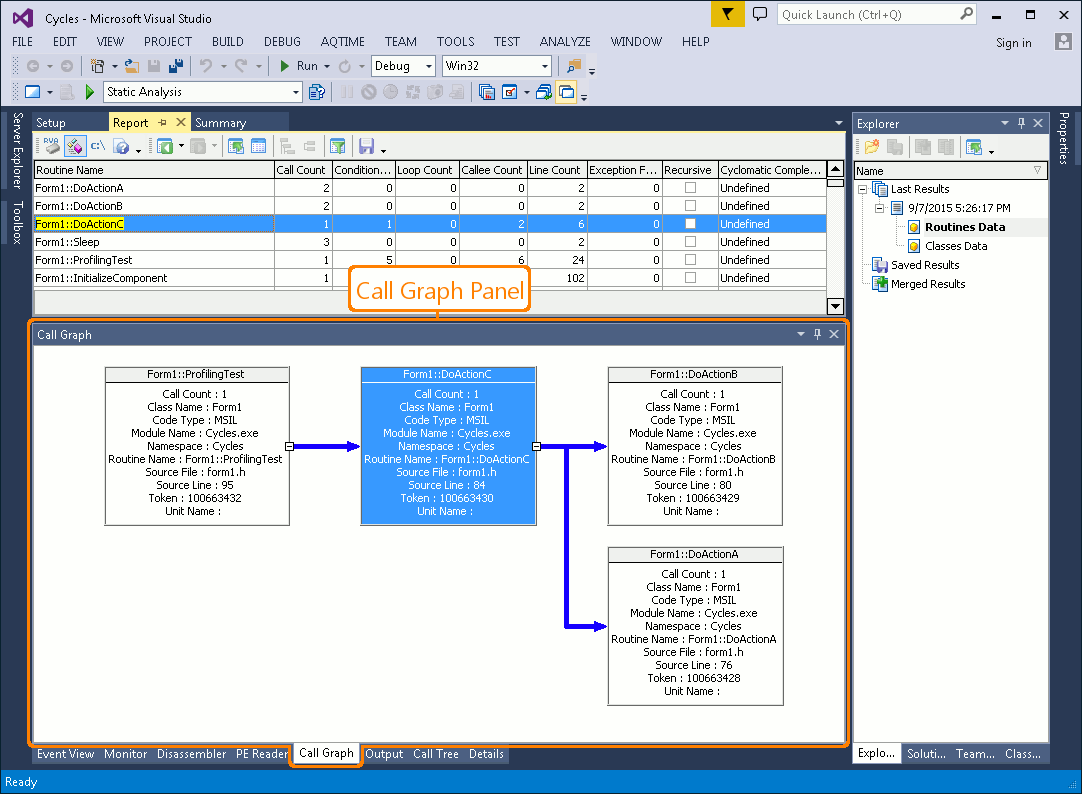
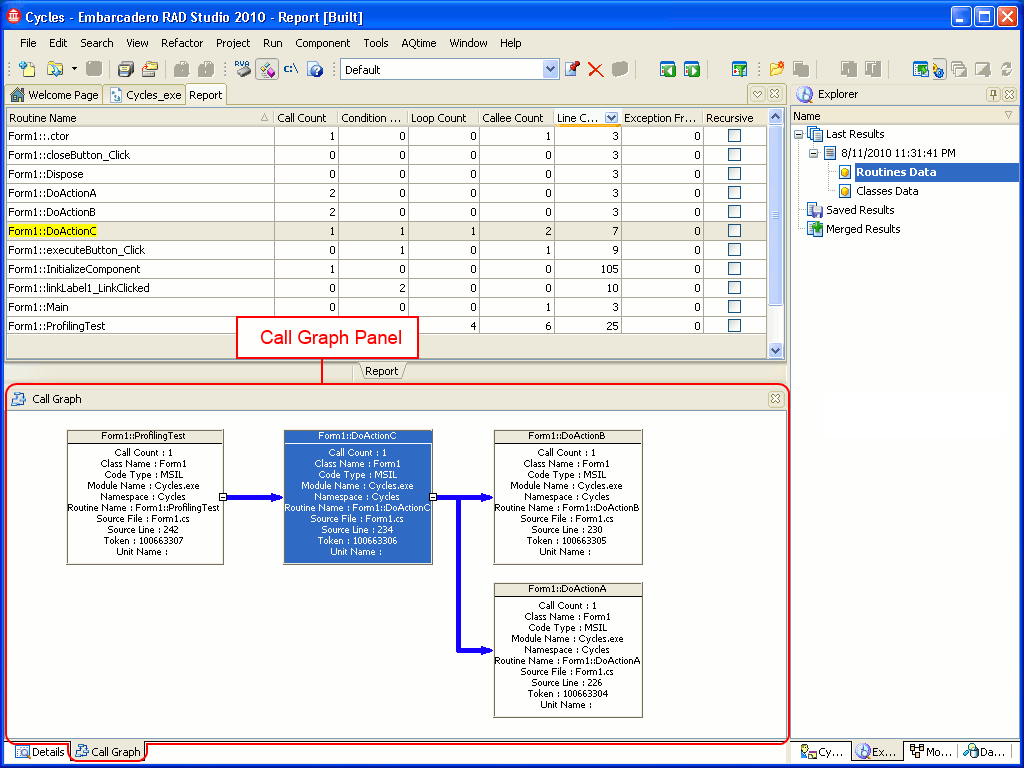
The Call Graph panel represents the hierarchy of calls in your application.
To display the Call Graph panel, do any of the following:
-
Select Call Graph from the View > Other Panels menu.
-
Select Call Graph from the Select Panel dialog which is called by selecting View > Select Panel.
-
Select Call Graph from the Assistant panel.
-
Select Call Graph from the Select Panel dialog which is called by selecting AQTime > Panel List.
-
Select Call Graph from Visual Studio’s Solution Explorer.
-
Select Call Graph from the Assistant panel.
-
Select Call Graph from the View > AQTime Profile Windows > Other menu.
-
Select Call Graph from the Assistant panel.
The following image displays the overall view of the Call Graph panel:
What Information the Call Graph Panel Displays
The Call Graph panel can be used with the following profilers:
- Performance
- Function Trace profiler
- Reference Count profiler
- Allocation profiler
- Static Analysis profiler
Depending on which profiler is used, Call Graph may display the hierarchy of calls for objects or routines, object references, potential function calls and so on. For more information, see Call Graph Panel Contents.
Information On the Call Graph Panel
| To learn more about... | See these topics... |
| Data displayed in the panel | Call Graph Panel Contents |
| Working with data displayed in the panel | Working With the Call Graph Panel |
| Panel's settings | Call Graph Panel Settings |
| Panel's context menu | Call Graph Panel Context Menu |
See Also
Call Graph Panel
Call Graph Panel Settings
Customize Call Graph Dialog
6. Analyzing Profiling Results


