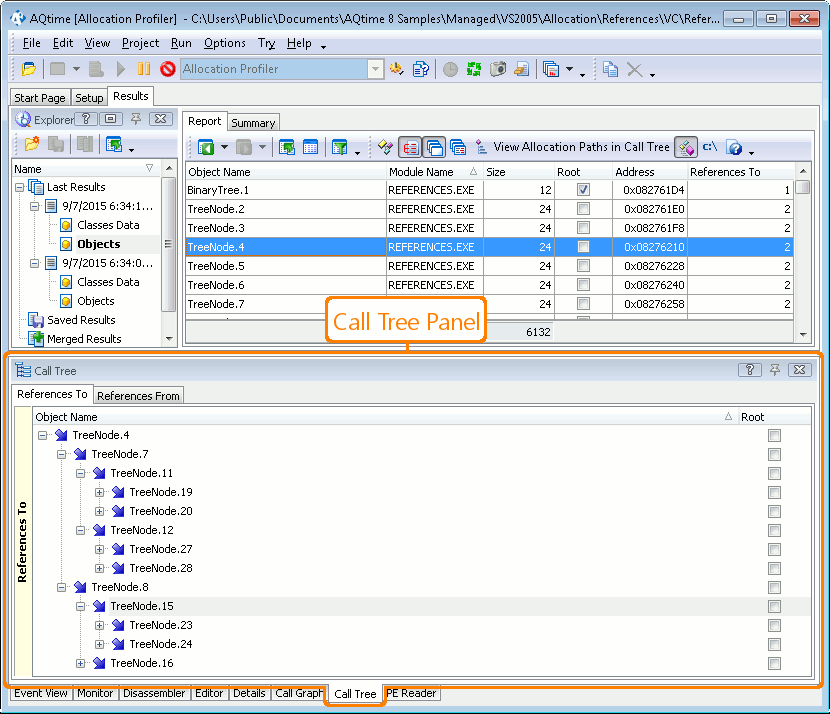
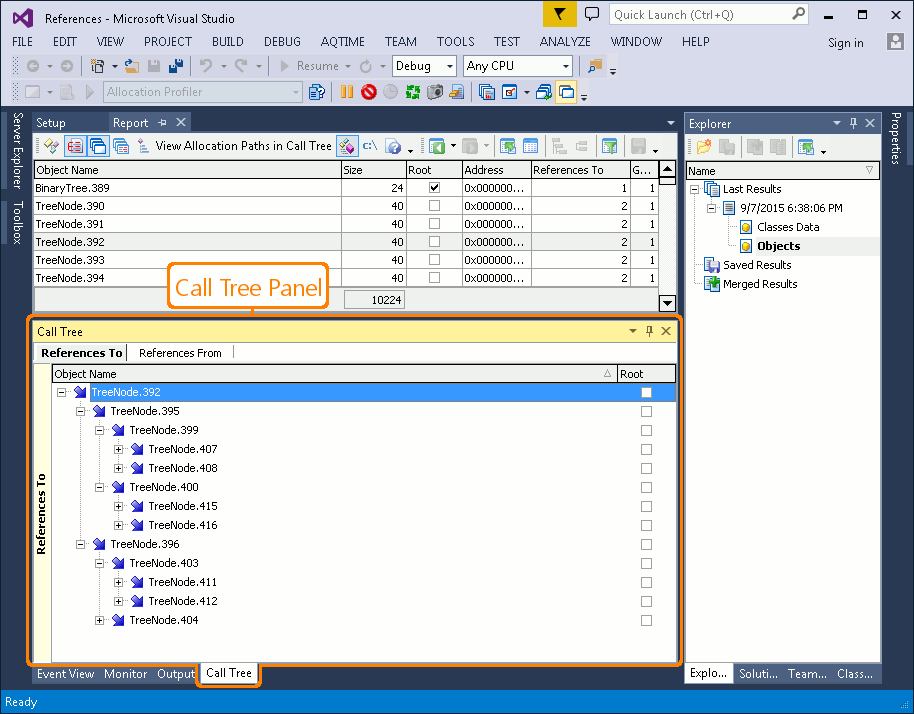
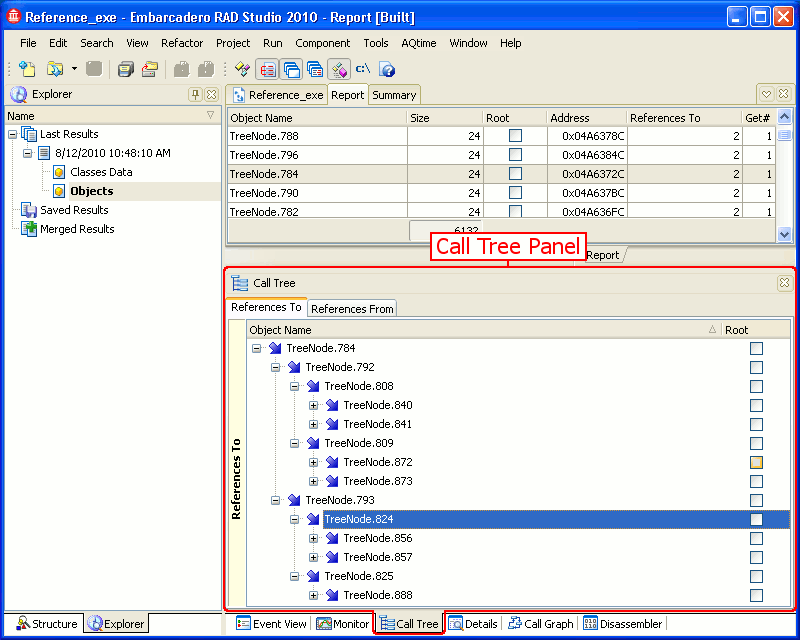
The Call Tree panel displays a hierarchy of calls for the routine, class or object currently selected in the Report panel.
To display the Call Tree panel, do any of the following:
-
Select Call Tree from the View > Other Panels menu.
-
Select Call Tree from the Select Panel dialog, which is called by selecting View > Select Panel.
-
Select Call Tree from the Assistant panel.
-
Select Call Tree from the Select Panel dialog, which is called by selecting AQTime > Panel List.
-
Select Call Tree from Visual Studio’s Solution Explorer.
-
Select Call Tree from the Assistant panel.
-
Select Call Tree from the View > AQTime Profile Windows > Other menu.
-
Select Call Tree from the Assistant panel.
The image below demonstrates the overall view of the panel:
What Information the Call Tree Panel Displays
The Call Tree panel can be used only with the following profilers:
The panel displays a tree view that represents the hierarchy of routine calls or object references. The panel’s contents depend on the profiler used to generate the results.
For details information, see Call Tree Panel Contents.
Information on the Panel
| To learn more about … | See these topics … |
|---|---|
| Data displayed in the panel | Call Tree Panel Contents |
| Working with the data displayed in the panel | Working With the Call Tree Panel |
| The panel's settings | Call Tree Panel Settings |
| The panel's context menu | Call Tree Panel Context Menu |
See Also
Call Tree Panel
Call Tree Panel Settings
Analyzing Profiler Results


