The output of AQTime's profilers can be displayed in a pre-selected form by defining filters. A filter defines conditions that records (report lines) must meet in order to be displayed in the Report panel.
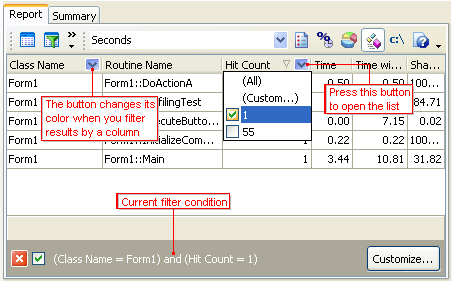
The easiest way to filter results is to press the dropdown button in the header of a column in the Report panel. Pressing the button opens a list that holds all values displayed in this column. Select the desired value from this list and the Report panel will only display those records which hold the selected value in the column (see the image below). This is also called auto-filtering. This is the easiest and fastest way to display results for all of the routines a class, unit or module contains.

You can filter results on several columns: just select the filtering value for each of these columns. For example, on the picture above the filter is applied on the Class Name and Hit Count columns. The current filter conditions are displayed at the bottom of the Report panel. To disable the filter, simply uncheck it there. To remove the filter, press the  button. To modify the filter conditions for the chosen column, select (Custom...) from the dropdown list and use the ensuing Custom Filter or Filter dialog. You can also modify the entire filter (for all columns) by pressing the Customize button and using the subsequent Filter dialog.
Another way of filtering results is to select  Filter on the Report toolbar or context menu. This will call the Filter dialog that lets you create custom filter conditions. You can use wildcards in conditions (the
 _ and % symbols) to search for the desired values in string columns (see Filter Dialog).
Once you have created the desired filter in the dialog, press OK to save and apply the filter. You can also save the current filter to or load it from a file.
One final way of filtering results is to use result views. A result view combines the filter expression and column layouts in AQTime panels, for one profiler. To apply a result view, simply select it from the Result Views dropdown list on the Standard toolbar or from the View > Result Views menufrom the Result Views dialog. To call it, select AQTime > Result Views from Visual Studio’s main menufrom the Result Views dialog. To call it, click the  Result Views button. Note that this button does not reside on any RAD Studio’s toolbar by default. However, you can add the button to any toolbar via the Toolbar Customization dialog. In this dialog, switch to the Commands page, select the View.AQTime category in the Categories list, drag the Result Views command from the Commands list and drop it on the needed toolbar.. There are several predefined result views for each profiler type. You can also create your own views. For more information on this, see Result Views.
See Also
Searching Results
Sorting Results
Grouping Results
Result Views
