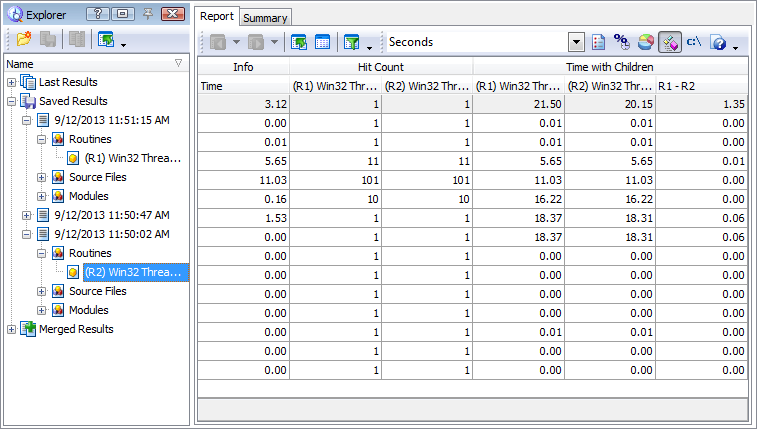
See how to compare results of several profiler runs:
| Comparing Profiler Results |
Suppose you have profiled a procedure and found out that it is slow. After optimizing its algorithm, you profile it again. Using the comparison feature you can easily see the difference in a single comparison report.
You can compare any number of records of the result sets displayed in the Explorer panel.
| Note: | You can compare results from the same categories only. For instance, you cannot compare Allocation profiler results if one of them is stored in the Classes category and the other - in the Objects category.
If you compare Performance profiler results, make sure they were generated by the same counter. AQTime cannot compare results that were generated by different counters. |
To compare results, do the following:
-
In the Explorer panel, select the records you want to compare.
-
Choose
 Compare from the Explorer toolbar or from the context menu.
 -
If the Always set up Compare parameters option of the Explorer panel is enabled, the Compare Settings dialog appears. In the dialog, specify the comparison settings:
-
In the Compare column, select the columns you want to be compared and shown in the comparison report.
-
If you want to compare two records, in the Difference Style column, you can choose a rule that specifies which arithmetic operations should be performed on the selected pair of results to show the difference between them. If you have selected more than two records for comparison, the Difference Style column contains None, which means that the columns of each record will be displayed next to each other.
-
Click OK to close the dialog.
-
-
The Report panel shows the comparison report.

You can also view the most recent code for the routine selected in the Report panel in the EditorCode EditorEditor and Disassembler panels.
Note: The Details, Call Graph and Call Tree panels are not available in the comparison mode.
See Also
About the Explorer Panel
Explorer Panel Settings
Compare Settings Dialog
Merging Results
