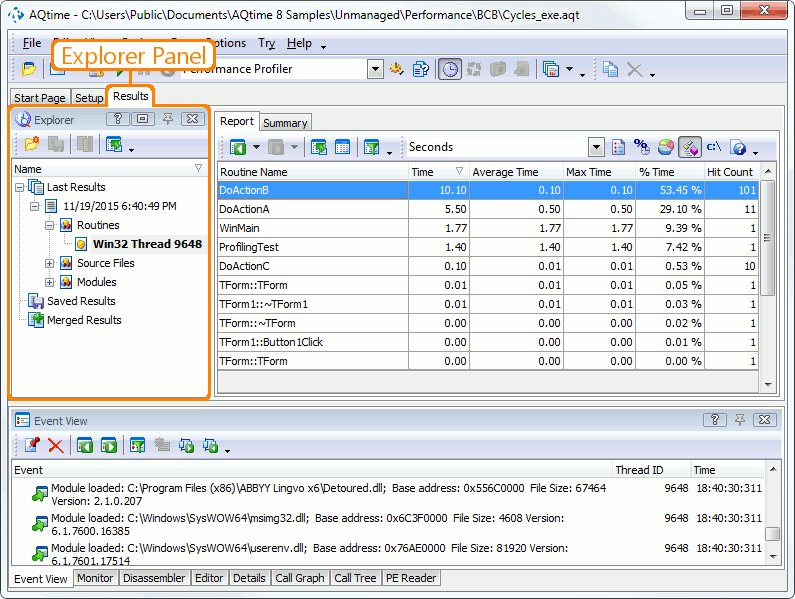
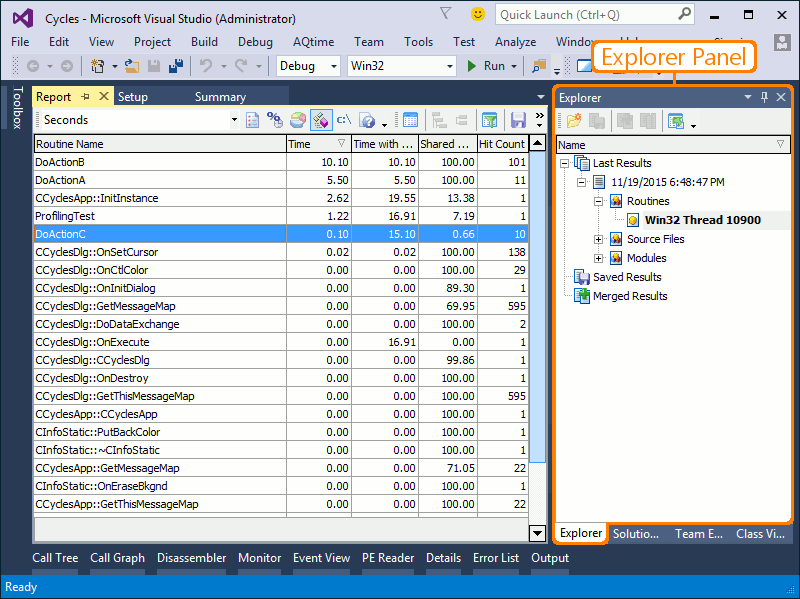
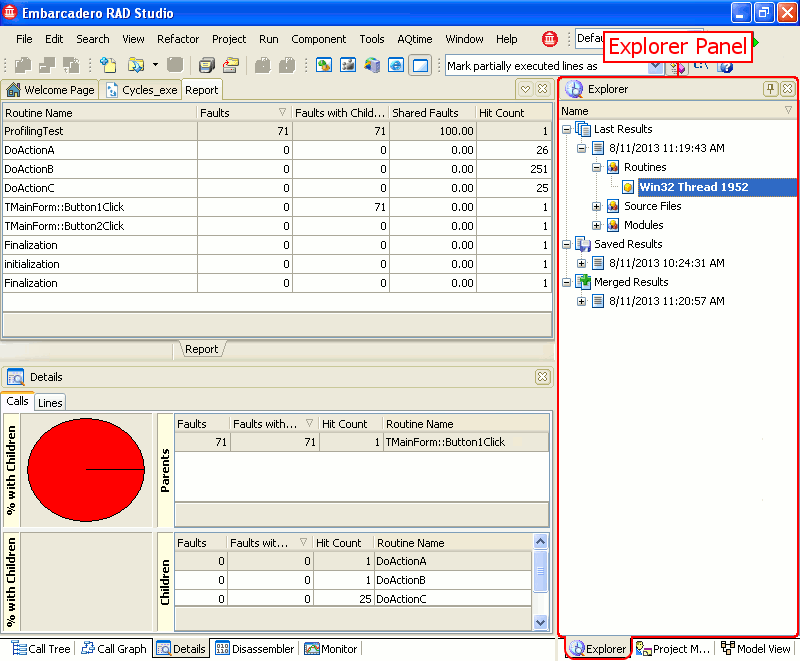
The Explorer panel serves to manage the profiling results, which are displayed as a tree-like structure in the panel. The result set selected in the Explorer panel is displayed in the Report panel.
To display the Explorer panel do any of the following:
- Select Explorer from the View menu.
- Select Explorer from the Select Panel dialog, which is called by selecting View > Select Panel.
- Select Explorer from the Assistant panel.
- Select Explorer from the Select Panel dialog, which is called by selecting AQTime > Panel List.
- Select Explorer from Visual Studio's Solution Explorer.
- Select Explorer from the Assistant panel.
- Select Explorer from the View > AQTime Profile Windows menu.
- Select Explorer from the Assistant panel.
The image below shows the overall view of the Explorer panel:
What Information the Explorer Panel Displays
The Explorer panel shows result sets that were generated during profiling sessions. Depending on the profiler used to collect data, result sets can be organized into categories, and within the categories they can also be divided into threads.
For a detailed description of the data displayed in the Explorer panel, see the Explorer Panel Contents topic.
About the Collected Results
To view the data collected during a profiling session, select the desired result set in the Explorer panel and then double-click the needed category or thread. The main profiling results are displayed in the Report panel; additional information (if any) is displayed in other panels (such as Details and others).
For a detailed description of what information result sets contain, see the description of the profiler that generated the results.
Information on the Explorer Panel
| To learn more about … | See these topics … |
|---|---|
| Data displayed in the panel | Explorer Panel Contents |
| Working with the data displayed in the panel | Working With the Explorer Panel |
| Panel's settings | Explorer Panel Settings |
| Panel’s context menu | Explorer Panel Context Menu |
You can customize the layout of the Explorer panel in the same way you customize any other AQTime panel. For example, you can change the Explorer panel’s size, position and docking, hide the panel or make it visible. To learn how to customize the interface, see Working With Panels.
Information on Working With Profiling Results
| For information on … | See … |
|---|---|
| Analyzing profiling results | Analyzing Profiling Results |
| Comparing profiling results | Comparing Results |
| Merging profiling results | Merging Results |
| Exporting profiling results | Exporting Results |
| Exporting profiling results to database | Exporting Profiling Results to Database |
See Also
Explorer Panel
Report Panel
Details Panel
Analyzing Profiling Results


