
The Summary panel displays brief profiling results for the result set that is currently selected in the Explorer panel. To display the Summary panel, do any of the following:
- Select Summary from the View menu.
- Select Summary from the Select Panel dialog, which is called by selecting View > Select Panel.
- Select Summary from the Assistant panel.
- Select Summary from the Select Panel dialog, which is called by selecting AQTime > Panel List.
- Select Summary from Visual Studio's Solution Explorer.
- Select Summary from the Assistant panel.
- Select Summary from the View > AQTime Profile Windows menu.
- Select Summary from the Assistant panel.
Here is a sample view of the Summary panel:
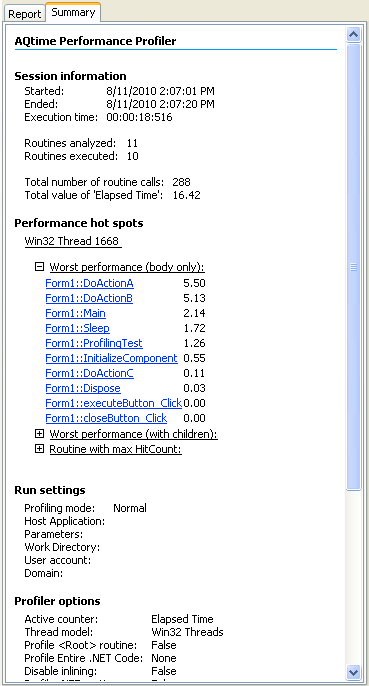
The contents of the Summary panel depend on the current profiler, for example:
- For Allocation profiler results, the Summary panel reports about classes that are used the most and least often, namely:
- Name of the class with maximum number of existing instances,
- Name of the class with peak number of created instances,
- The number of existing instances of classes that were included in profiling tasks,
- The number of total created objects,
- Etc.
- For Performance profiler results, the Summary panel contains information about routines that are performing poorly. This information depends on the counter you used to obtain the results. The Summary panel shows:
- Routines with maximum Hit Count value,
- Routines with top values in the Time (for example, Misses or Branches) columns,
- Routines with top values in the Time with Children (for example, Misses with Children or Branches with Children) columns,
- Etc.
- For Failure Emulator profiler results, the Summary panel contains information about the total number of simulated application failures.
Besides the profiler-dependant information, the Summary panel shows the time of the profiler run, information about profiler options, operating system, CPU, memory and so forth.
The Summary clearly pin-points the sections of code that need to be optimized. This frees you from searching for this code in the profiling results yourself. To view detailed information on a routine or class that is shown in the Summary panel, simply click this routine or class in the panel. AQTime will then update its panels (for example, Report or Details) so that they display information regarding the routine or class you have clicked on.