Selenium is an open-source tool for automating browser-based applications. Selenium scripts test your website by simulating user behavior – they navigate through web pages, click links, submit forms, and verify that the expected text or elements are present on the pages.
AlertSite Enterprise lets you use Selenium scripts to ensure your critical business transactions are working correctly. You can upload Selenium scripts and run them from AlertSite global monitoring locations, measuring the transaction response time. Selenium scripts run in real browsers – Chrome and Firefox – so they accurately model real user experience.
Supported technologies
-
Selenium 2.x (WebDriver) scripts written in Java using the JUnit framework. If you use Selenium IDE to record scripts, it has an option to export scripts to the Java JUnit format.
-
Browsers: Chrome (recommended), Firefox*.
Note: The browser to use is specified in the Selenium script. -
Web drivers: ChromeDriver (recommended), FirefoxDriver*, MarionetteDriver*.
-
Java 1.8.x.
-
Framework: You can use the JUnit framework to write your Selenium tests, or you can write your own simple
main()function. -
Allowed traffic: HTTP, HTTPS.
-
Screen size: 1280×1024 is the default browser window size at AlertSite monitoring locations.
* Firefox support is in beta and there are some known issues.
Selenium 1.0 (RC) and Selenium Grid are not supported.
| Note: | Selenium monitors are full-page monitors and consume usage credits at the fullpage rate. |
Considerations for private locations
Private locations support Selenium monitoring starting from Private Node Server v. 2.0. A firewall rule may be required to allow download of your Selenium scripts from the AlertSite platform to your private locations (see Network Connectivity).
Prepare JAR file for AlertSite
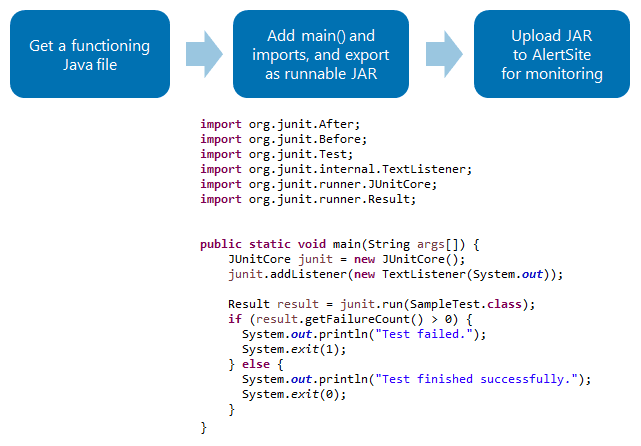
It is easy to reuse your Selenium scripts written in Java to create AlertSite monitors. All you need to do is to add two small code snippets into your working Java code, then export your project as a runnable JAR file.
Check out the step-by-step tutorials:
- For Selenium IDE users: Create Runnable JAR From Selenium Script Using Eclipse
- For Eclipse users who write Selenium Java tests manually: Export Eclipse Java Project as Runnable JAR
As a result, you will get a JAR file that can be run using this command:
Before you upload it to AlertSite, make sure it is played back successfully on your computer.
See also Guidelines for Selenium Scripts.
Create a Selenium monitor in AlertSite
Once you have a runnable JAR file, you can upload it to AlertSite:
AlertSite UXM
-
On the Dashboard, hover over + Add New and select Monitorn.
-
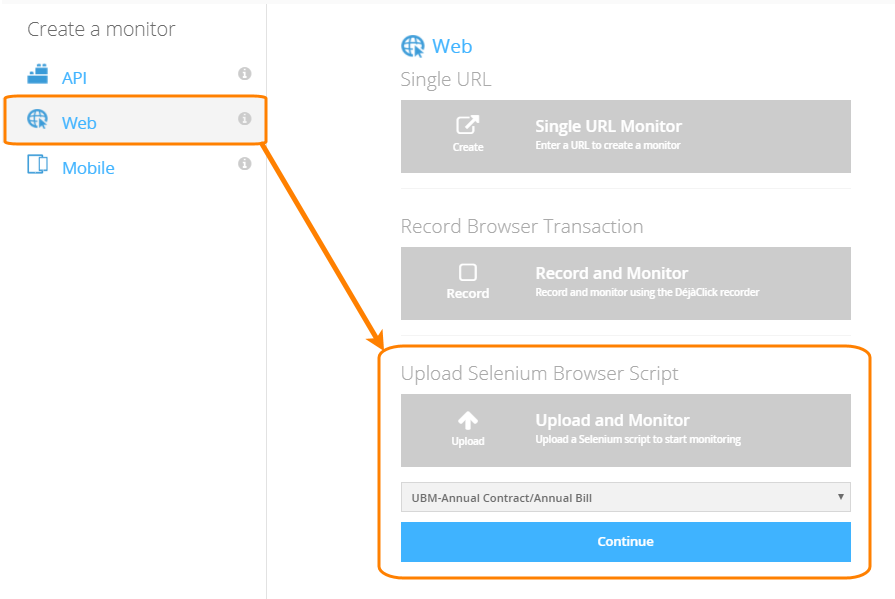
Select Web and click Upload and Monitor.
-
If you have multiple AlertSite plans, select the plan to be used for this monitor.
Note: If you have the VM Node plan (monitoring from private locations only), make sure you use Private Node Server 2.0, because earlier versions do not support Selenium. -
Click Continue.
-
Browse for your JAR file and click Submit.
-
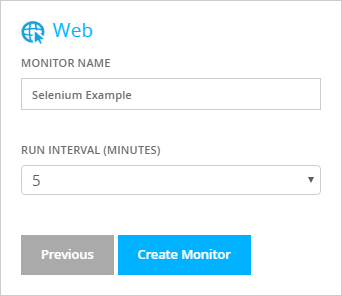
Name your monitor and select the run interval (the default value is 5 minutes).
-
Click Create Monitor.
-
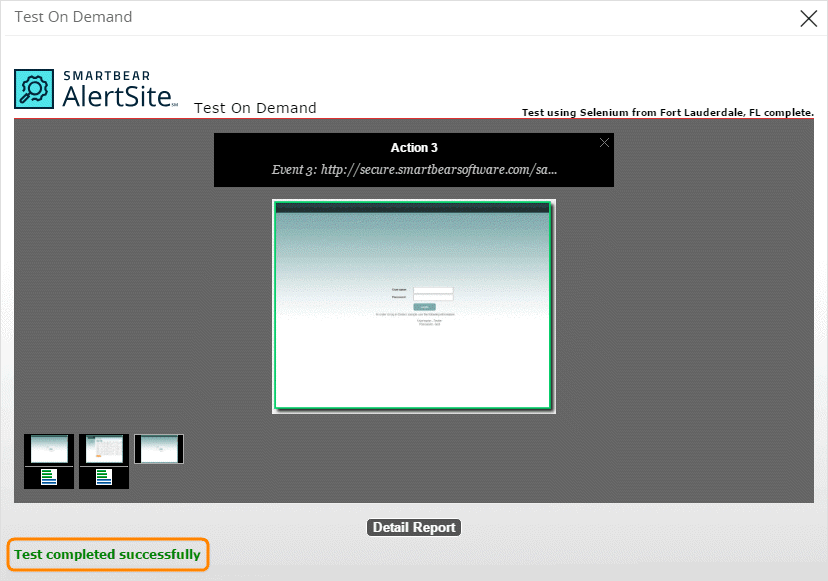
On the next screen, you can run a test on demand to verify your JAR file. This is required only if your Selenium monitor will run from AlertSite global locations. If you selected the VM Node plan for your monitor, skip this test.
When you are ready to continue, click No thanks, I'm done.
-
The next screen is the monitor configuration where you can select locations for the monitor, configure timeouts and other parameters.
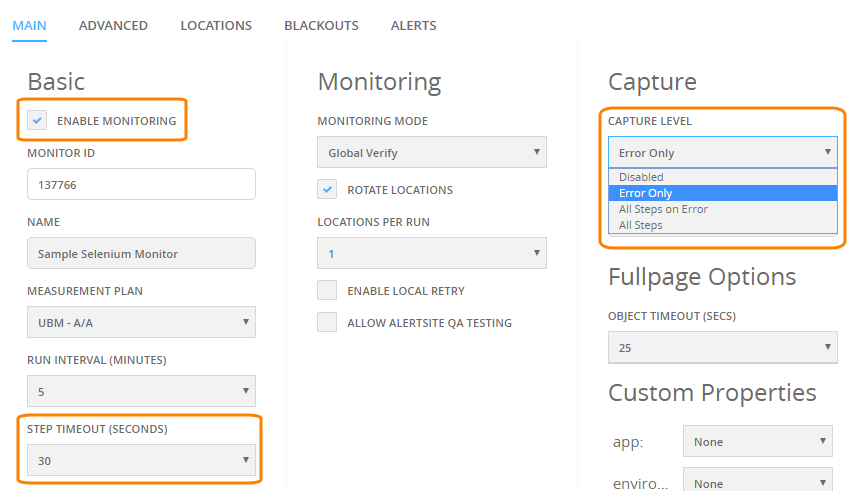
Note: By default, new Selenium monitors are disabled. You need to enable the monitor manually by selecting the Enable Monitoring check box..
Some useful configuration options are:
-
Capture Level – Set this to at least Error Only. This will capture additional information to help troubleshoot errors, such as: web page screenshots, web page’s HTML source code, HTTP request and response headers, and the console output from the JAR file.
-
Step Timeout – The maximum acceptable full-page response time for each web page. This value includes the load time of the page and all of its images, scripts, and other resources. Pages that take longer to load will be indicated in reports.
-
Browser Timeout – The page loading timeout as the maximum waiting time for the DOM Load and Page Load events. The script will be stopped if these events are not received within the timeout interval. This is a per-page timeout.
-
Object Timeout – The timeout for page assets – images, JavaScript files, CSS files, Ajax requests, and so on. Resources that take longer to load will be displayed with an error status in the run results and reports.
-
Browser Version – The Chrome version for playback.
-
Locations – Select the monitoring locations to run your Selenium script from.
Note: Private nodes support Selenium monitors only starting from Private Node Server 2.0. For more information about these and other settings, see Selenium Monitor Settings.
-
Click Start Monitoring Now!.
AlertSite 1.0
-
From the top menu, select Configure > Selenium Scripts.
-
Click Add a New Script at the upper right.
-
Click Choose File and browse for the JAR file.
-
Configure the monitor settings:
-
Transaction Name – The name of the monitor. By default, this is the name of the JAR file you have uploaded.
-
Site Plan – Select the plan to be used for this monitor.
Note: For the VM Node plan (monitoring from private locations only), make sure you use Private Node Server 2.0, because earlier versions do not support Selenium. -
Check Every – Set the monitoring interval.
-
-
Click Submit.
-
If you are going to run your Selenium monitor from AlertSite global locations, you need to run a test on demand to verify your JAR file.
Now you can select locations for the monitor, configure timeouts and other parameters.
| Note: | By default, new Selenium monitors are disabled. You need to enable the monitor manually by selecting Enabled from the Monitoring Is drop-down list. |
Some useful configuration options are:
-
Capture Level – Set this to at least Error Only. This will capture additional information to help troubleshoot errors, such as: web page screenshots, web page’s HTML source code, HTTP request and response headers, and the console output from the JAR file.
-
Step Timeout – The maximum acceptable full-page response time for each web page. This value includes the load time of the page and all of its images, scripts, and other resources. Pages that take longer to load will be indicated in reports.
-
Browser Timeout – The page loading timeout as the maximum waiting time for the DOM Load and Page Load events. The script will be stopped if these events are not received within the timeout interval. This is a per-page timeout.
-
Timeout Objects After – The timeout for page assets – images, JavaScript files, CSS files, Ajax requests, and so on. Resources that take longer to load will be displayed with an error status in the run results and reports.
-
Playback Engine – The Chrome version for playback.
-
Locations – Select the monitoring locations to run your Selenium script from.
Note: Private nodes support Selenium monitors only starting from Private Node Server 2.0. For more information about these and other settings, see Selenium Monitor Settings.
-
Click Submit.
Your Selenium monitor will now run at the configured intervals. The data should appear on AlertSite dashboards in about 5-10 minutes.
Understanding Selenium run results
How it works
AlertSite locations have the Firefox and Chrome browsers installed. Each Selenium script begins the run with a clear browser cache. The script launches and closes a browser, navigates to web pages and simulates user actions on the pages. As the script runs, AlertSite tracks which pages are opened and measures the response time for each web page. Individual pages are reported as monitor steps.
OK and error statuses
The monitor status in AlertSite is determined by the exit code of the JAR file rather than the status of individual web pages. The JAR file must return status 0 if all tests were successful and a status > 0 on error, as shown here. This means that if an error occurred during the script (for example, a page could not be loaded), but the script returned exit code 0, the monitor status will be OK.
Page errors (like HTTP errors or loading timeouts) are indicated in the monitor run details and in reports, but do not affect the monitor status and your SLA metrics.
AlertSite does not specifically track the status of JUnit test cases (@Test methods) in your JAR file, but you may be able to see this information in the run log.
Monitoring results
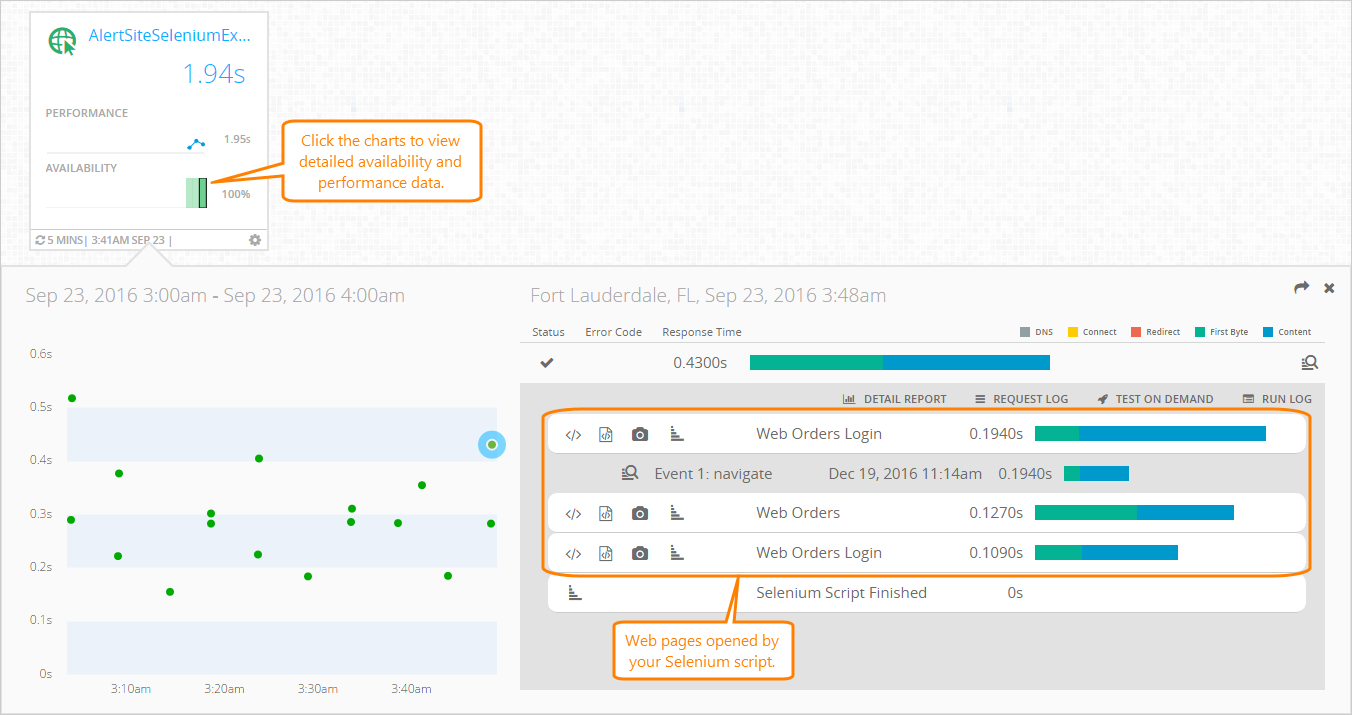
In addition to the overall OK and error statuses, Selenium monitoring results include:
-
The list of all web pages opened by the script. Pages are represented as monitor steps.
-
The response time for each page and page assets, including the DNS time, connect time, DOM Load, full page response time (page and all page assets), and other metrics.
-
The status of each page and page asset: OK, HTTP error, or response time exceeded the timeout.
-
Waterfall charts for each page.
-
Run log containing the console output from the JAR file (to help troubleshoot errors).
Page waterfalls and content breakdown
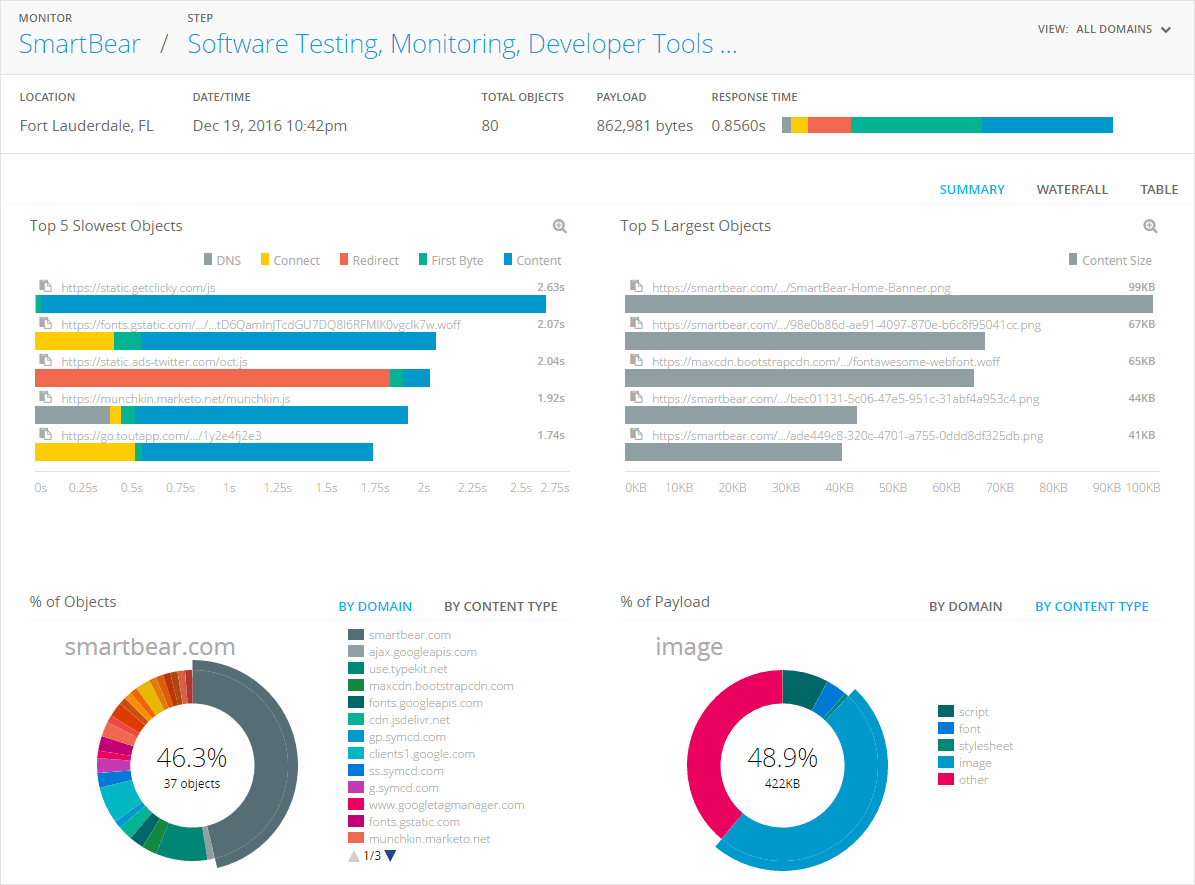
Clicking next to individual pages in test run results opens the Run View with waterfall charts and content breakdown. Here you can see the slowest and largest objects that affect your web page response time.
Run log
AlertSite can save the console output from Selenium monitors to help with troubleshoot monitor status 20 “Selenium-specific error”. The monitor needs to have the Capture Level option set to enable this. The console output will be available as the Run Log in the monitor run results.
The run log includes:
-
Custom messages logged by
System.out.println()in your Selenium Java code. You can use this to annotate the script execution progress. -
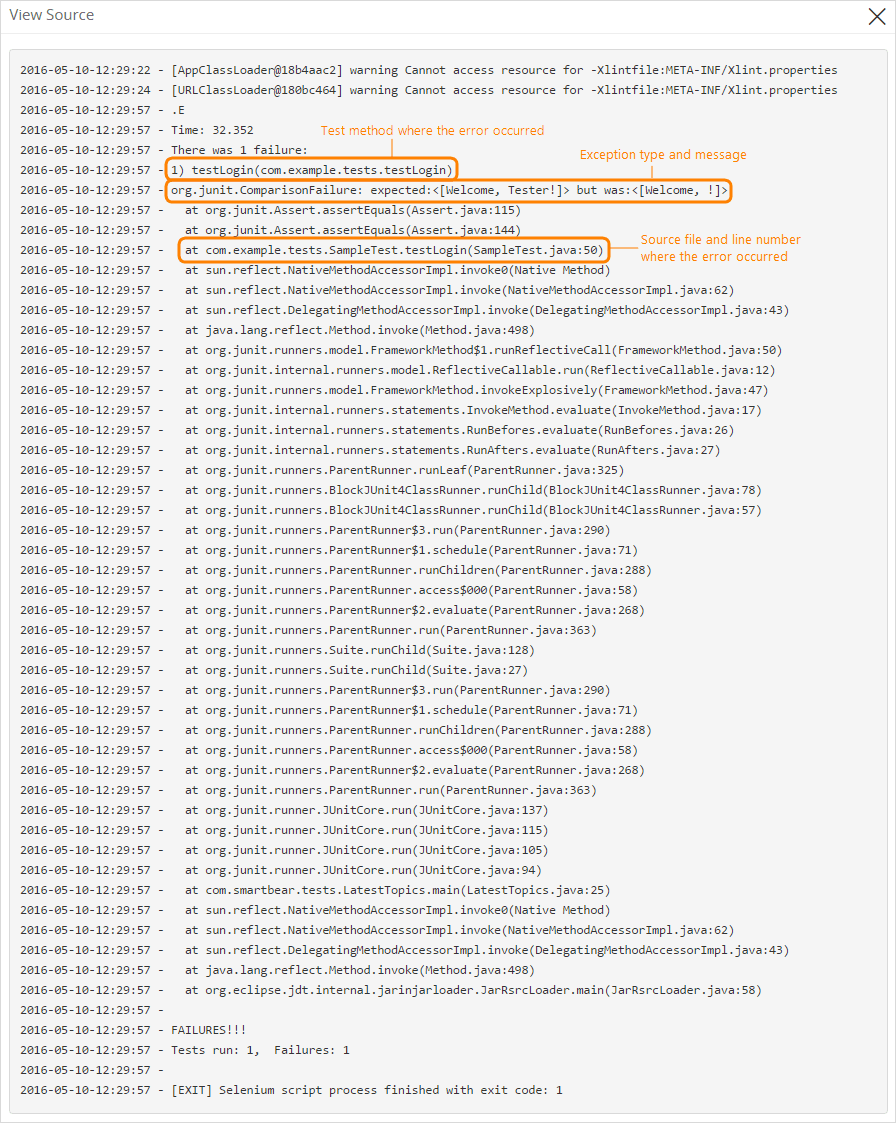
Output produced by the JUnit framework (if you created your Selenium script using JUnit). This typically includes error details such as the name of the failed test method, the error message and the exact line number in the Selenium script where the error occurred.
Note: To include JUnit output in the AlertSite run log, your
main()method must contain this line:junit.addListener(new TextListener(System.out));
If you followed the tutorial to create a JAR file, this is already done. If not, add this line (see the recommended
main()method code for an example).
Here is a sample run log that shows the error details:
You can also have this log attached to email alerts. To do this, select the Attach server response to email alerts option for your email alert recipients.
Limitations and known issues
Unsupported features
The following features are not supported for Selenium monitors:
- Step-level alerts
Firefox support
Support for Selenium Firefox monitors is currently in beta. The following issues are known to exist:
-
DNS failures halt the execution, causing monitor status 20. However, expanded runs on the Monitor Runs dashboard and the Detail report do indicate the DNS error (status 51) for the corresponding URLs.
-
Connection timeout causes the browser to hang and is reported as status 95.
-
Occasionally, page screenshots and timings are missing from the Firefox replay. This is because the Marionette driver does not wait for the page load to complete before proceeding to the next event, so AlertSite may not be able to capture performance data at times.
Warnings in Run Log
Selenium Run Log may include the following warnings at the beginning:
[AppClassLoader@18b4aac2] warning Cannot access resource for -Xlintfile:META-INF/Xlint.properties
[URLClassLoader@180bc464] warning Cannot access resource for -Xlintfile:META-INF/Xlint.properties
You can ignore these warnings. They do not affect the functionality of your Selenium scripts.

 How to run a test on demand

