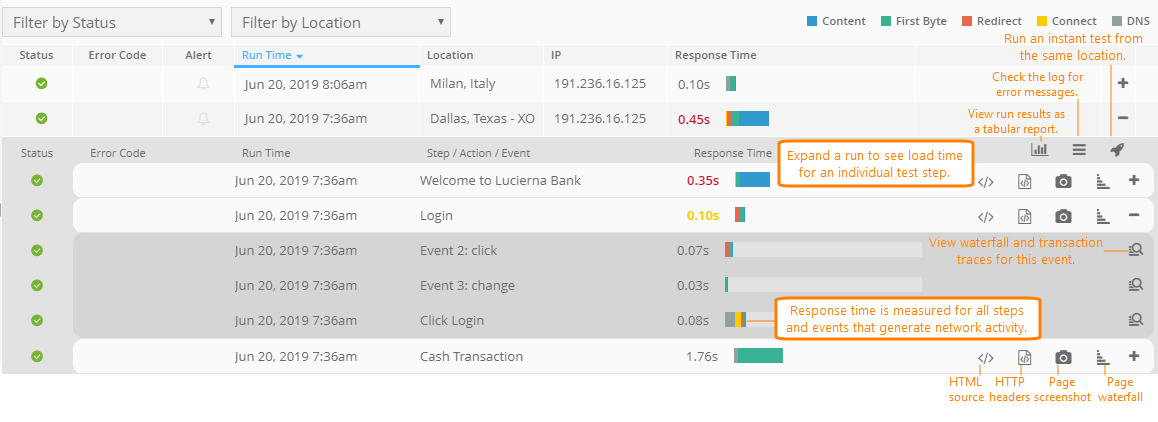
You can review detailed results of each test performed by your website monitors on AlertSite Monitor Runs dashboard. Here you can see the status (OK/error) and response time breakdown of each test step.
This topic explains dashboard features specific to web URL, real-browser and mobile web monitors. For a description of other items, see Monitor Runs Dashboard.
Run Details
Start by selecting a monitor and time frame and find a run of interest. Expand the results down to individual steps and events to see which exactly steps are slow or failing. Step details include the response time breakdown, waterfall showing a timeline graph of webpage loading, and (depending on the monitor type and configuration) page screenshots and HTML source.
See the sections below to learn more about available troubleshooting tools:
Page Screenshots and HTML
AlertSite can capture screenshots and HTML source code of the monitored pages to help you troubleshoot errors. Captures are supported for real-browser and mobile web monitors with the Capture Level enabled. This option determines whether data is captured for all steps or just on error.
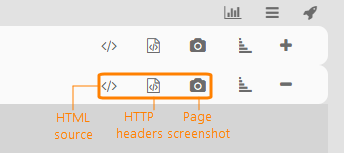
You can view the captured data by using the buttons next to transaction steps.
Waterfall View
Events that load pages, make Ajax requests, or generate other network activities are marked with the ![]() icon. Clicking the
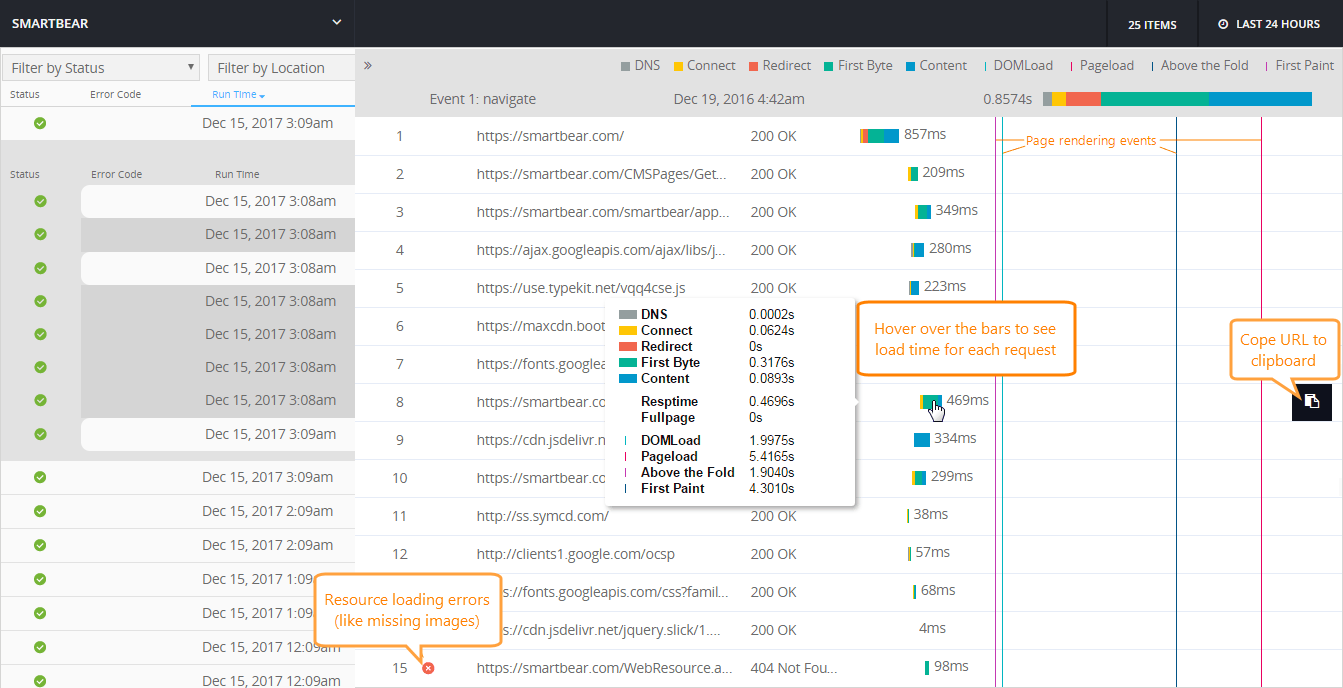
icon. Clicking the ![]() icon opens the waterfall timeline for that event. The waterfall shows all the requests sent while loading the page, as well as the resource loading time – from the moment a request was initiated till the last received byte of the response. It is similar to what web developers can see in Firebug or Chrome Developer Tools.
icon opens the waterfall timeline for that event. The waterfall shows all the requests sent while loading the page, as well as the resource loading time – from the moment a request was initiated till the last received byte of the response. It is similar to what web developers can see in Firebug or Chrome Developer Tools.
| Note: | Waterfall includes images, scripts, and other page resources only for fullpage monitors. Monitors without this option load just the base page without external resources. |
Perceived Load Time
For real-browser (DéjàClick) monitors, the waterfall timeline shows vertical lines that indicate browser events (DOM Load, Page Load) and page rendering events (First Paint, Above the Fold). These metrics reflect the user-percieved page load time, as opposed to network timings. For more information about these metrics, see Web Page Load Time.
AppDynamics Transaction Traces
AlertSite integrates with AppDynamics to collect data related to the code path a transaction takes from the application server all the way to the back end databases. If the monitor is enabled for AppDynamics transaction tracing, requests in the waterfall have the ![]() button that opens the related transaction snapshot.
button that opens the related transaction snapshot.
Page Object Errors
Error icons next to page resources usually indicate resource loading errors, such as images or scripts that were not found on the server. You can see the URL and HTTP status code of the failing resources. Web developers should fix these errors or update the page to remove references to invalid resources.
If the monitor uses the Alert and report if page assets are missing or new or Alert and report if the size of a page asset changes options options, errors can also mean unexpected changes in the page since the last test, such as:
-
The file size of an image, script or other file was changed
-
A new image, script or other file was added to the page since the last test
-
An image, script or other file was removed from the page since the last test
If you do not want to monitor page objects for changes, we recommend that you disable the Alert and report if page assets are missing or new and Alert and report if the size of a page asset changes options options.
Request Log
The request log shows all requests to made to the monitored web page(s) during the test. Here you can find the URL of the page in error and the error message. The error message is the same as included in email alerts. For example, keyword validation errors (status 5) include the phrase that was not found on the page.


