The Simple TCP Connect monitor connects via TCP to the specified port on the server and reports an error if the connection could not be established. The TCP monitor is at a higher level than ping, but lower than other monitors such as a website URL, email or FTP.
How it works
The monitor connects to the specified server and port and performs a 3-way TCP handshake with an open port listener on a server. If the connection could not be established within the specified timeout period, the monitor reports status 1 “TCP connection failed” and, depending on your alerting settings, triggers an alert. Status 1 is an indication that your server is overloaded, or is not running, or your firewall is blocking the connections.
Requirements
Your firewall must allow TCP connections to the target server and port from the IP addresses of AlertSite locations you are monitoring from.
Create a TCP monitor
AlertSite UXM
-
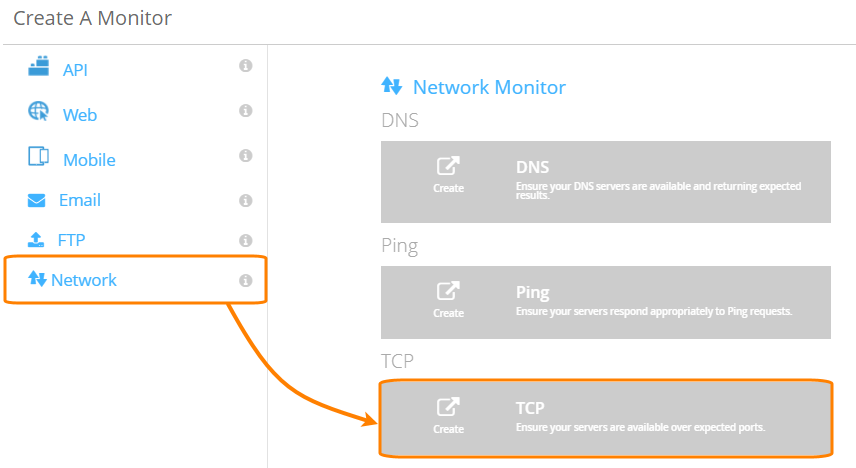
On the AlertSite UXM Dashboard, hover over + Add New and select Monitor.
-
Select Network on the left and click TCP.
-
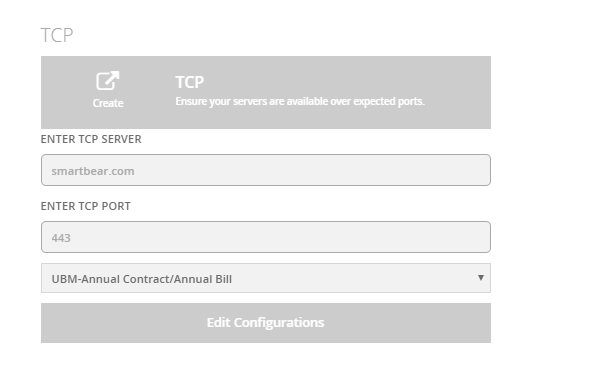
Specify your tested server:
-
TCP Server – The domain name or IP address to connect to. For example, example.com, subdomain.example.net or 8.8.8.8. Do not include http(s):// or subpaths. Note that domains with and without www are different.
-
TCP Port – (Optional.) The port to connect to. Typical ports are 80 or 8080 for HTTP, 443 for HTTPS. Default is 80.
-
Select a billing plan for this monitor. If you have private locations and wish to run the monitor only at private locations, select the VM Node, InSite, or PrivateNode EndPoint plan, depending on the type of your private locations.

-
-
Click Edit Configurations.
-
Configure other settings:
-
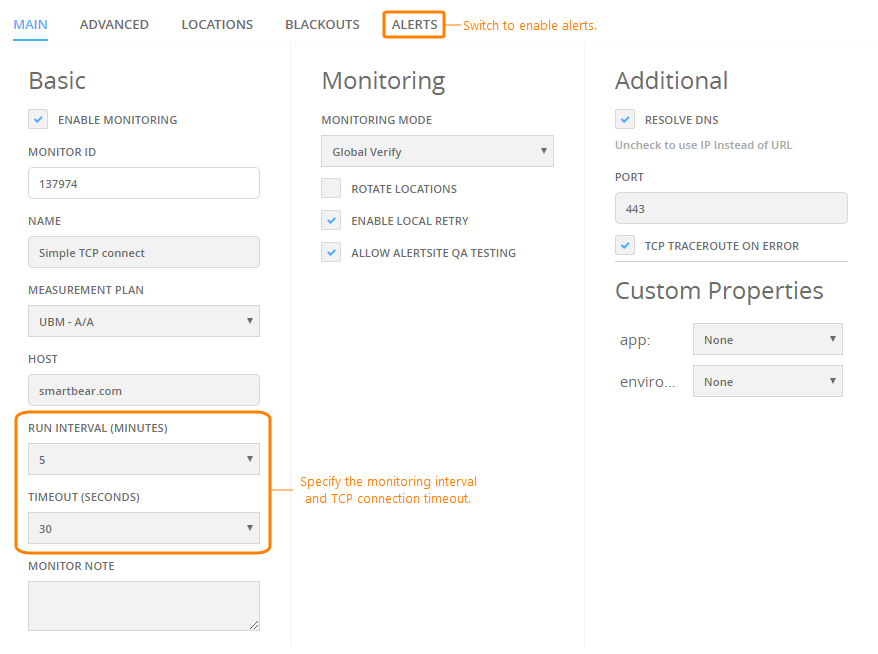
Run Interval – How often the monitor will run.
-
Timeout – TCP connection timeout, in seconds.
-
Locations – Select the locations for your monitor. The default locations for all new monitors can be configured in your account settings.
-
Alerts – Enable alerts to be alerted when the monitor cannot connect to your server.
-
-
Click Start Monitoring Now!
-
Run a test on demand to verify the monitor configuration. The results will be displayed on the screen. If there are errors, double-check your server name and port, and make sure your firewall allows connections from our IP addresses.
AlertSite 1.0
-
Navigate to Configure > Sites and click Add a new site.
This will open the monitor configuration screen.
-
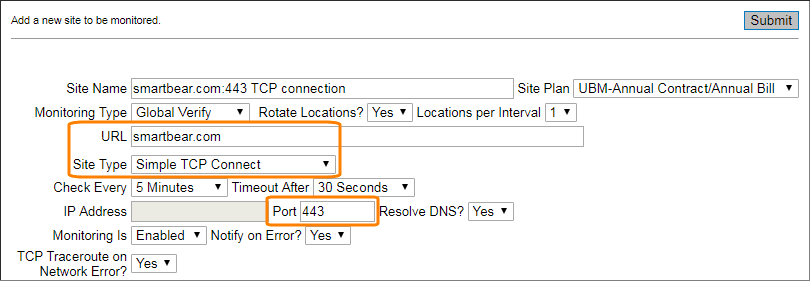
Specify the basic settings:
-
Site Type – change to Simple TCP Connect.
-
URL – the domain name or IP address to connect to. For example, example.com, subdomain.example.net or 8.8.8.8. Do not include http(s):// or subpaths. Note that domains with and without www are different.
-
Port – the port to connect to. Typical ports are 80 or 8080 for HTTP, 443 for HTTPS. Default is 80.
-
Enter a name for this monitor in the Site Name field.
-
From the Site Plan list, select the billing plan for this monitor. If you have private locations and wish to run the monitor only at private locations, select the VM Node, InSite plan, or PrivateNode EndPoint plan, depending on the type of your private locations.
-
Select the monitoring frequency (Check Every) and the time to wait for a response (Timeout).
-
(Recommended.) Set Notify on Error? to Yes to be alerted when the monitor cannot connect to your server.
-
-
Click Submit in the top right corner. AlertSite will create the monitor and display additional settings.
-
(Optional.) Click Locations in the top right corner and select the locations to run the monitor from. The default locations for all new monitors can be configured in your account settings.
-
Click Test on Demand to test your monitor. If there are errors, double-check your server name and port, and make sure your firewall allows connections from our IP addresses.
Your monitor is now ready and will run at the specified intervals. You will see the first results in AlertSite in a few minutes.
You can change the monitor settings at any time later if you wish. See TCP Monitor Settings for a description of applicable settings.
| Note: | In AlertSite 1.0 (classic interface), only some of the displayed settings apply to TCP monitors. |


 Configure Alert Recipients