An API endpoint monitor sends one or more HTTP requests to an API and checks the response time, status and response contents. For each step (request), you can define assertions to verify the response data. You can also define variables to extract data from responses and use it in subsequent requests.
API monitors can also be created from OpenAPI (Swagger) definitions or by uploading a ReadyAPI or SoapUI project.
Create a monitor
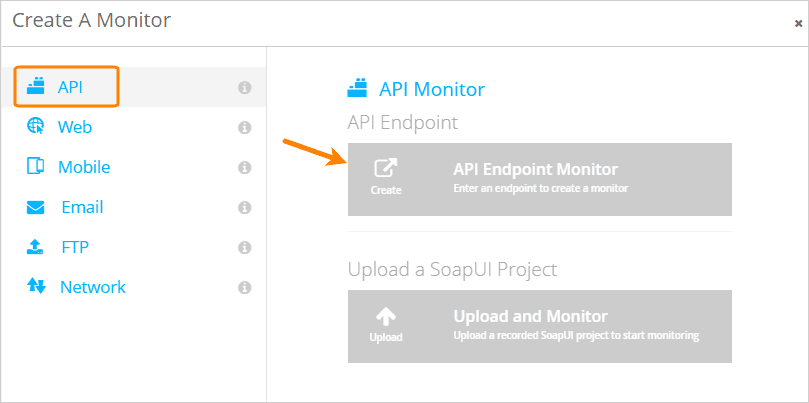
Start on the AlertSite UXM Dashboard, hover over + Add New, then select Monitor from the dropdown. Select API on the left, then click API Endpoint Monitor.
Configure HTTP request (URL, headers, body)
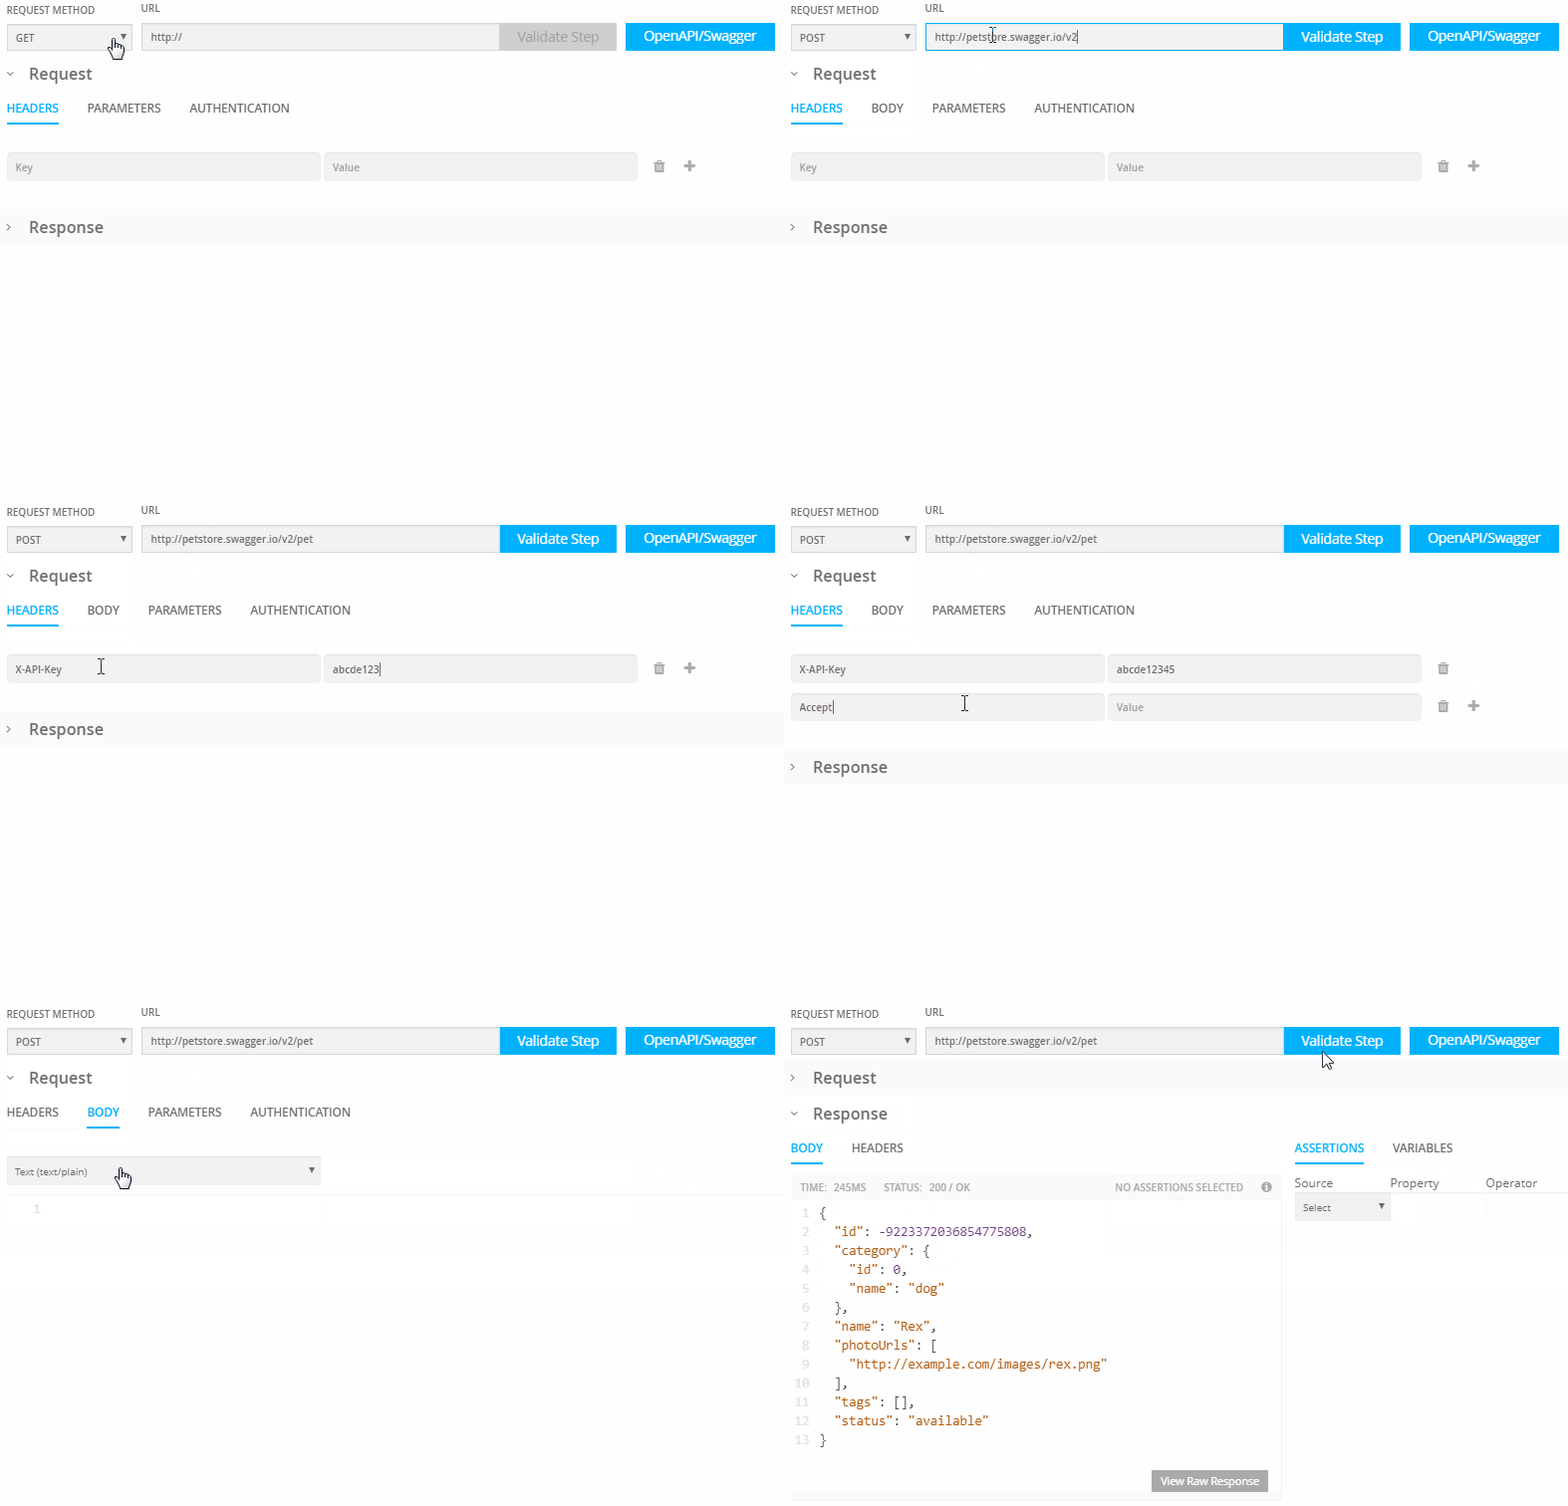
On the next screen, you can configure the request – specify the URL (including http:// or https://), request method (GET, POST or other), headers and body. The body is used only for POST, PUT, and PATCH requests.
Alternatively, you can click Swagger and import an OpenAPI (Swagger) definition that describes your API endpoints and parameters.
If you are sending a request body, such as JSON or XML, select the appropriate content type from the list. To use a different content type, select Custom and add the corresponding Content-Type header manually.
Notes:
-
Query string parameters should have unique names. Multiple parameters with the same name (such as ?tag=cats&tag=dog) are not supported.
-
When sending a body, make sure the body syntax is correct. AlertSite’s request editor validates the JSON syntax. If you are posting XML, use www.xmlvalidation.com to check your XML syntax.
Query parameters
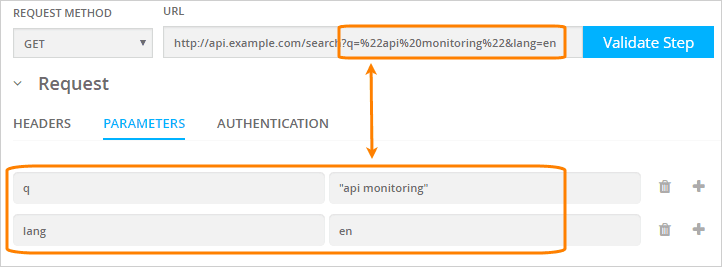
If the target URL uses query parameters, such as http://api.example.com/photos?tag=cats&size=large, you can append them directly to the URL, or specify them in the Parameters table. The request URL and the Parameters table are synchronized and automatically updated as you change either of them.
The parameter editor is handy if some parameter values contain reserved characters such as % ! & or others – you can enter the values as they are, and AlertSite will automatically encode these values in the request URL.
Click to add a new parameter, or to delete a specific parameter.
Note: Query parameters must have unique names. AlertSite API monitors do not support multiple query parameters with the same name.Authentication
Use the Authentication tab to configure the authentication method for the request:
-
Basic authentication – enter a username and password, and we will encode them for you and add the corresponding
Authorizationheader to requests.With some servers, you may also need to select the Authenticate pre-emptively check box to authenticate successfully. This will send the
Authorizationheader in the initial request, instead of expecting a 401 response before retrying the request with the credentials. -
Bearer token – enter a token to be sent in the
Authorization: Bearer tokenheader. Do not include the Bearer prefix in the token, it will be added automatically.
Other authentication methods can be used by adding necessary request headers or parameters manually. For example:
Validate request
After you have entered the request data, click Validate Step to send a sample request and see the response. If there is an error, double-check the request configuration (URL, headers and body).
After validating the request, you will be able to add assertions.
Assertions
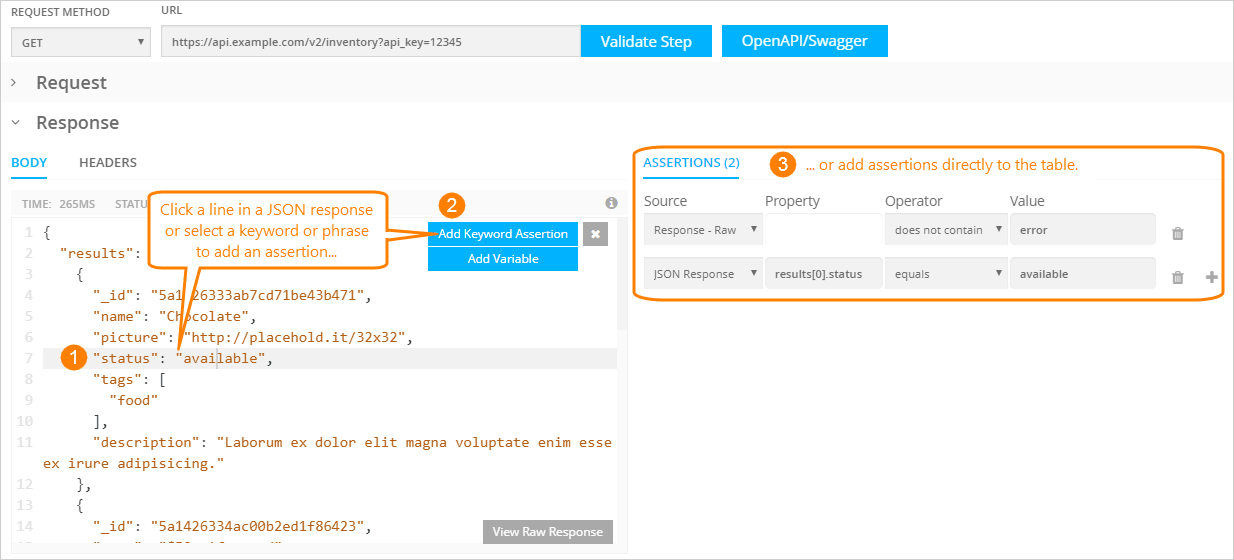
Assertions are used to verify the data returned in the response body or headers. For example, you can check the value of a specific JSON field, or search for a specific word in the response text. When a monitor runs the test, it is considered successful only if all of the assertions pass.
To add an assertion, click a line in JSON or select text in a text response, and click Add Assertion. You can also add assertions manually to the table. To learn more, see API Assertions.
Add more steps
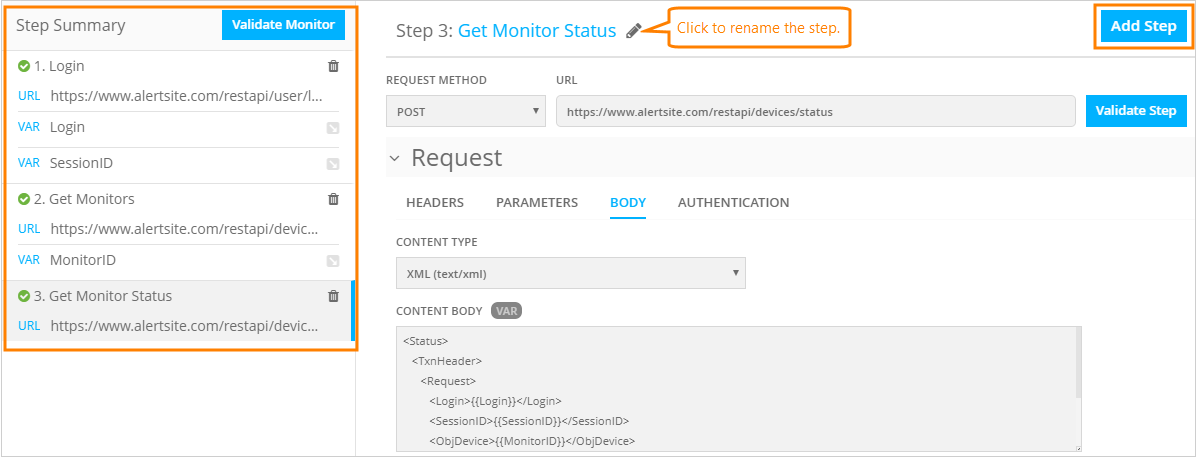
Click Add Step to add another request at the end of the test. This way you can create a sequence of chained API calls that use variables to pass data between the steps. AlertSite will run the steps in sequence, and the test will be considered successful only if all steps are successful. If a specific step fails, the rest of the steps will run.
Here is an example of a 3-step monitor:
| Note: | The maximum number of steps a monitor can have depends on your AlertSite plan. On most Usage-Based Monitoring plans, it is 50. |
After you have configured the steps, click Validate Monitor to test the requests. This runs a basic test with variable substitutions and checks for response status 2xx or 3xx. The Step Summary will indicate the step status:
– OK (the request is successful, all assertions passed).
– one or more assertions failed, or there is a problem with variable extraction.
– a response status other than 2xx or 3xx.
Variables
In multi-step monitors, you can use variables to extract data from JSON and XML responses and insert it into subsequent requests. See Variables for details.
Other monitoring settings
After you have configured all the steps, requests, and assertions, click Next to proceed.
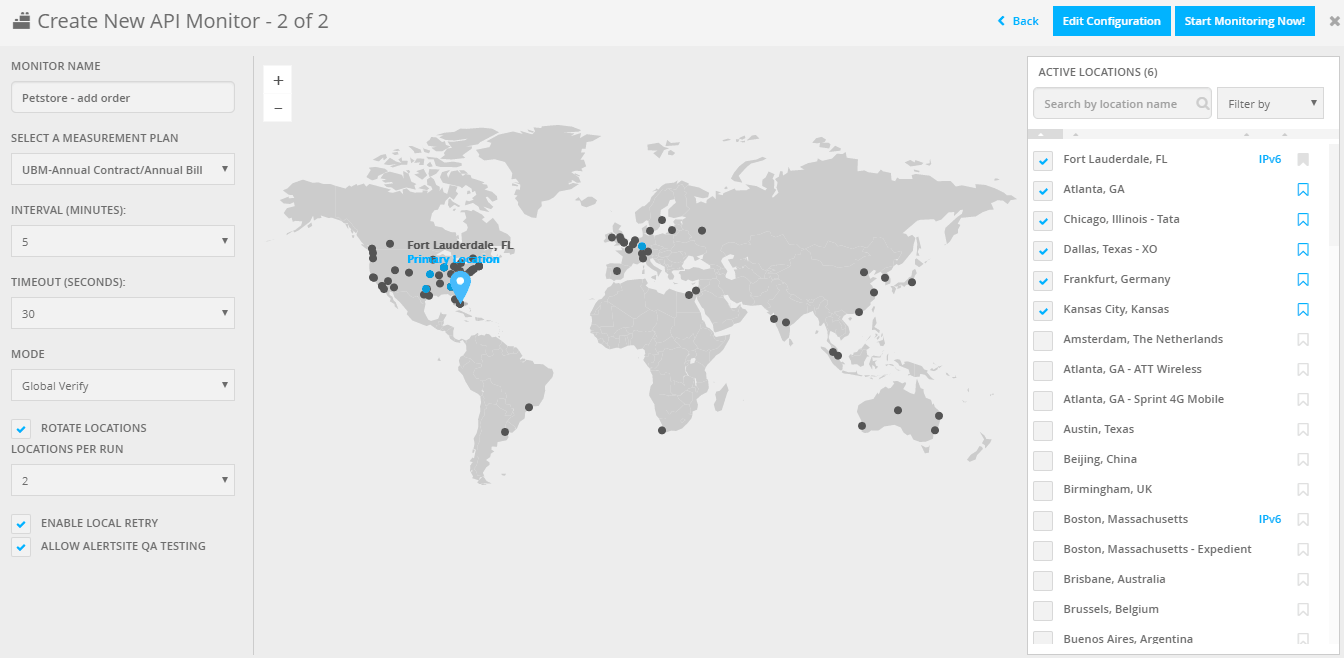
On the next screen, you can give your monitor a name, select the run interval, and the locations where the monitor will run. More settings are displayed if you click Edit Configurations in the top right corner.
Some useful settings are:
-
Step timeout – maximum acceptable response time for each step.
-
Capture level (accessible via Edit Configurations) – lets you store the request and response contents from the test runs.
For a description of all the settings, see API Endpoint Monitor Settings. You will be able to change all the settings later, if needed.
Once done, click Start Monitoring Now in the top right corner to create the monitor.
AlertSite will now monitor your API endpoint and alert you on errors. The first results will appear on the AlertSite Dashboard in a few minutes.
What’s next
FAQ
Which HTTP status codes are considered successful?
The following HTTP status codes are considered successful:
-
100, 200, 201, 202, 203, 204, 205, 206
-
301, 302, 303, 306 (to make them errors, select the Report redirects as errors monitor option)
-
401, 403 (to make them errors, select the Report authentication challenges as errors monitor option)
Any other codes are considered errors.
Is there a timeout for HTTP requests?
The request timeout is 1 minute (60 seconds) and is not configurable. However, the Step timeout lets you set the acceptable response time for requests. Steps with a longer response time will have error status 6570 in the monitor run results.
To use custom request timeouts, you will need to convert your API monitor to SoapUI and adjust the timeouts in the SoapUI project.
Is there a timeout for the entire test?
The time limit for the entire test is 10 minutes on AlertSite global monitoring locations and 20 minutes on private nodes. Tests that exceed the limit will trigger error 81 - “Maximum transaction time was exceeded”.
See Also
API Endpoint Monitor Settings
Converting API Endpoint Monitors to SoapUI
Creating API Monitors From OpenAPI (Swagger) Definitions

 API keys
 Configure alert recipients