The Ping monitor is the easiest way to ensure that a server or an Internet-connected device is reachable. This monitor sends a simple ping request to the specified domain name or IPv4 address to test for availability and potential network latency. This monitor is similar to the TCP monitor, but uses a lower-level protocol (ICMP), and can check not only web servers, but also arbitrary devices connected to the Internet.
Requirements
-
ICMP must be enabled on your server. Some hosting providers disabled ICMP for security reasons.
-
Your firewall must allow ICMP packets from the IP addresses of AlertSite locations you are monitoring from.
Considerations
-
Ping monitors can ping both host names and IP addresses (IPv4 only).
-
Ping does not use ports. To test connection to a port, use the TCP monitor instead.
Create a Ping monitor
AlertSite UXM
-
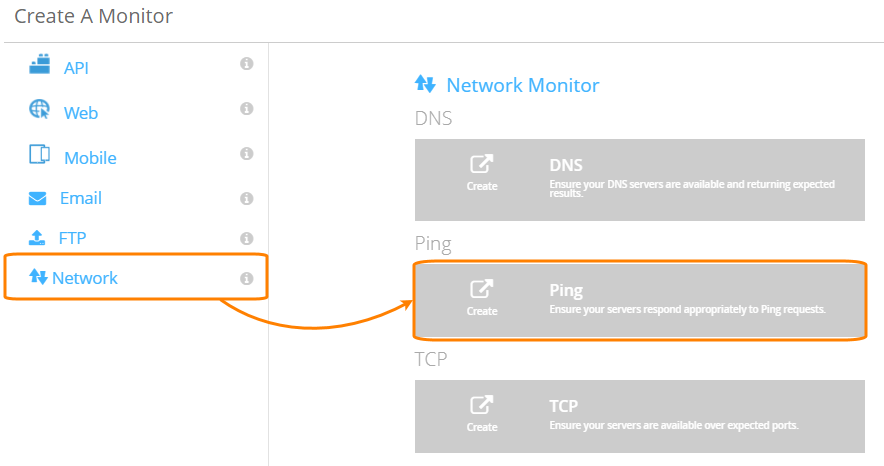
On the AlertSite UXM Dashboard, hover over + Add New and select Monitor.
-
Select Network on the left and click Ping.
-
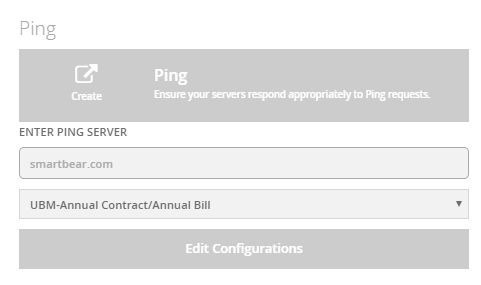
Enter the host name or IP address to ping, for example, mycompany.com or 8.8.8.8. Do not include http(s)://. Note that host names with and without www are different.
-
Select a billing plan for this monitor. If you have private locations and wish to run the monitor only at private locations, select the VM Node, InSite, or PrivateNode EndPoint plan, depending on the type of your private locations.

-
Click Edit Configurations.
-
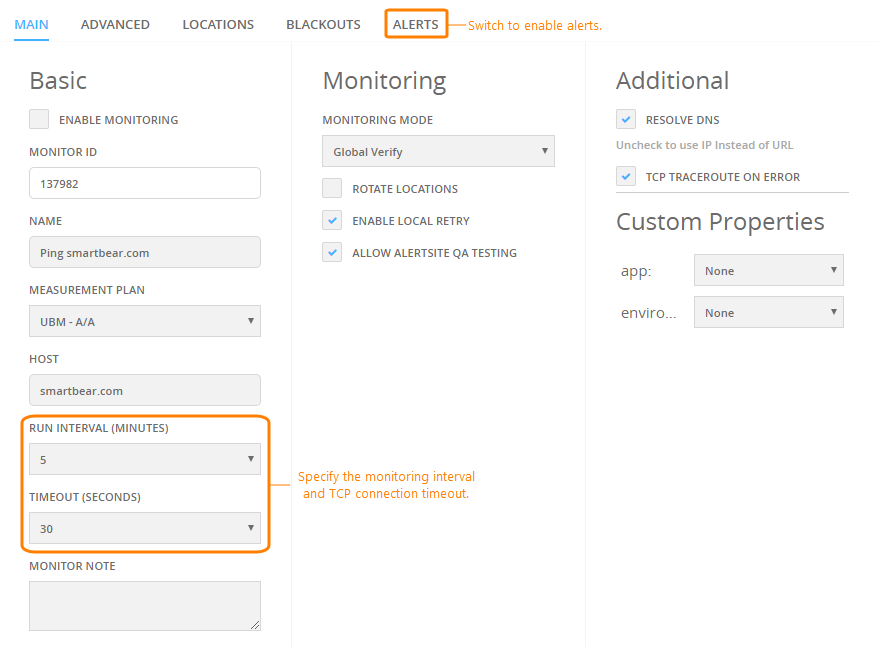
Configure other settings:
-
Run Interval – How often the monitor will run.
-
Timeout – The maximum time to wait for a ping response.
-
Locations – Select the locations for your monitor. The default locations for all new monitors can be configured in your account settings.
-
Alerts – Enable alerts to be alerted when your server or device does not respond to ping.
-
-
Click Start Monitoring Now!
-
Run a test on demand to verify the monitor configuration. The results will be displayed on the screen. If there are errors, review the monitor settings.
AlertSite 1.0
-
Go to Configure > Sites and click Add a new site:
This will open the monitor configuration screen.
-
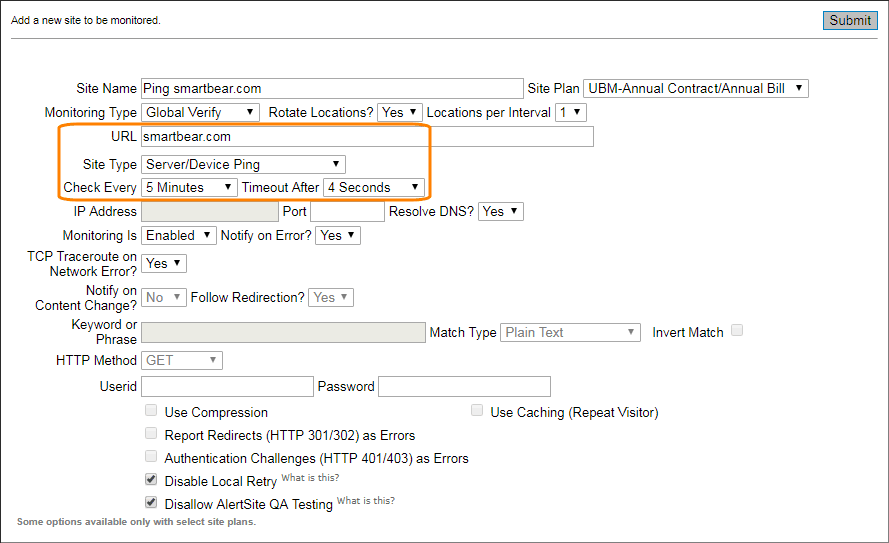
Specify the basic settings:
-
Site Type – Change to Server/Device Ping.
-
URL – The domain name or IP address to ping. Do not include http(s)://. Note that domains with and without www are different.
-
Site Name – The monitor name that will appear in the AlertSite dashboard, alerts and reports.
-
Site Plan – Select the billing plan for this monitor. If you have private locations and wish to run the monitor only at private locations, select the VM Node, InSite plan, or PrivateNode EndPoint plan, depending on the type of your private locations.
-
Check Every – How often the monitor will run.
-
Timeout – The maximum time to wait for a ping response.
-
(Recommended.) Set Notify on Error? to Yes to be alerted when your tested server or device does not respond to ping.
-
-
Click Submit in the top right corner. AlertSite will create the monitor and display additional settings.
-
(Optional.) Click Locations in the top right and select the locations the monitor will run from. The default locations for all new monitors can be configured in your account settings.
-
Click Test on Demand to test your monitor. If there are errors, review the monitor settings.
Your monitor is now ready and will run at the specified intervals. You will see the first results in AlertSite in a few minutes.
You can change the monitor settings at any time later if you wish. See Ping Monitor Settings for a description of applicable settings.
| Note: | In AlertSite 1.0 (classic interface), only some of the displayed settings apply to ping monitors. |


 Configure Alert Recipients