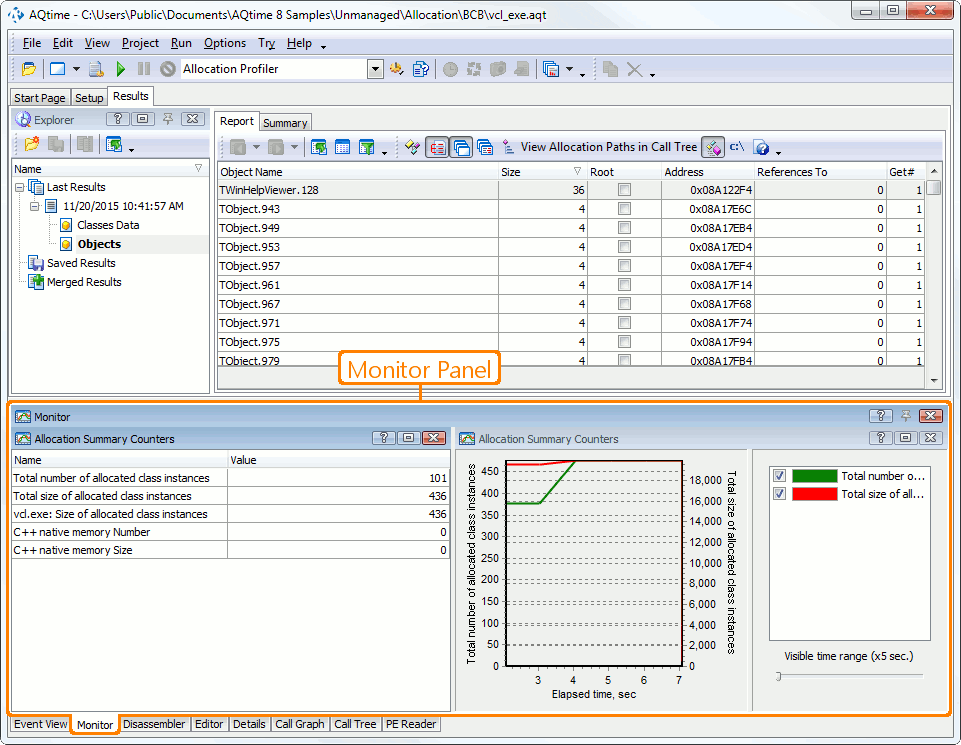
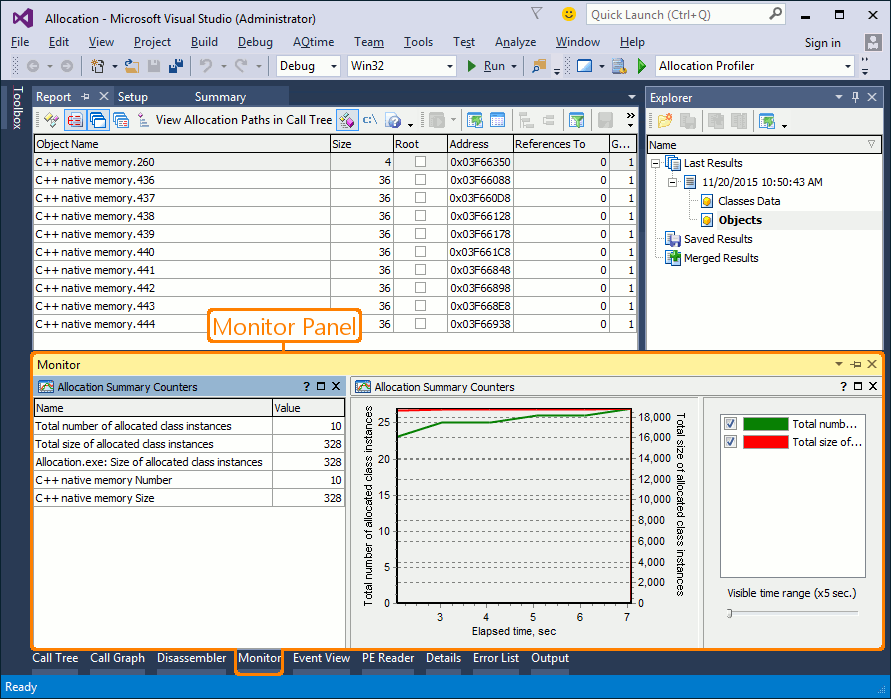
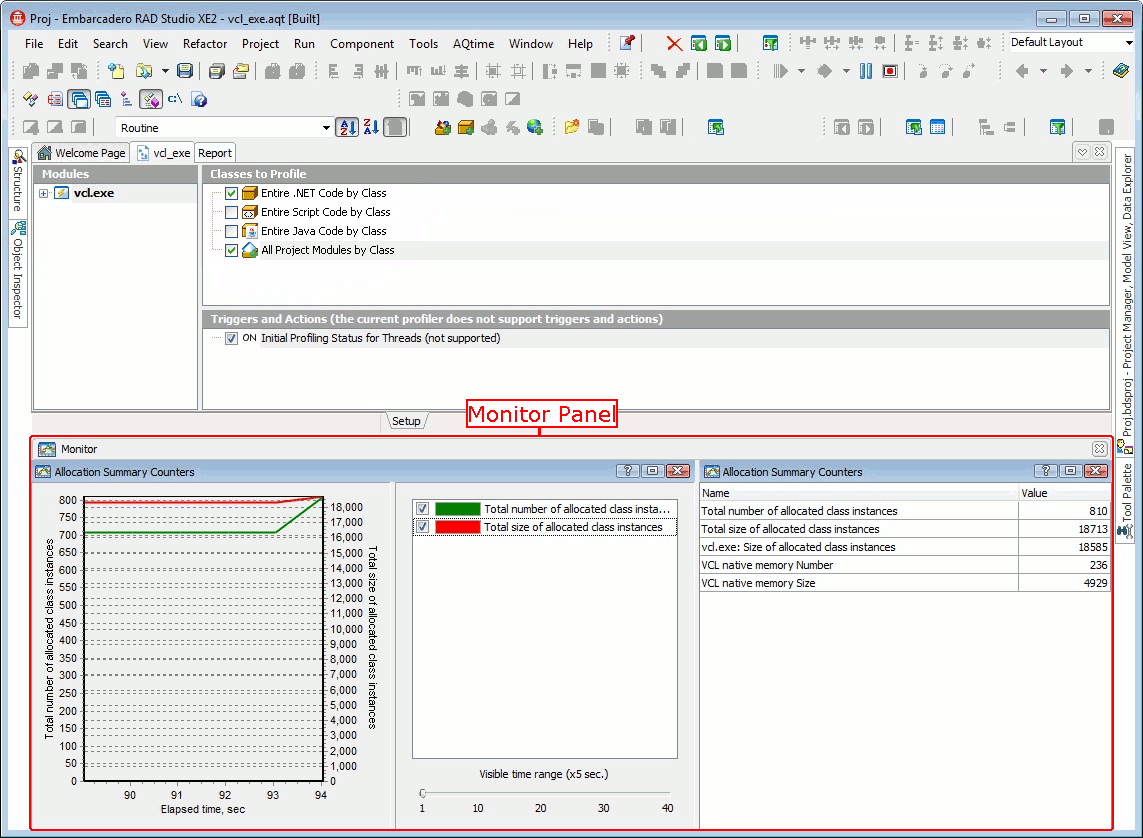
The Monitor panel is aimed at monitoring real-time memory usage. Currently, the Monitor works only with the Allocation profiler (see Using the Monitor Panel With the Allocation Profiler). When the Allocation profiler is running, the Monitor panel tracks creations and deletions of class instances as well as allocations and deallocations of memory blocks in the profiled application.
To display the Monitor panel, do any of the following:
-
Select Monitor from the View > Other Panels menu.
-
Select Monitor from the Select Panel dialog which is called by selecting View > Select Panel.
-
Select Monitor from the Assistant panel.
-
Select Monitor from the Select Panel dialog which is called by selecting AQTime > Panel List.
-
Select Monitor from Visual Studio’s Solution Explorer.
-
Select Monitor from the Assistant panel.
-
Select Monitor from the View > AQTime Profile Windows > Other menu.
-
Select Monitor from the Assistant panel.
| Note: | The Monitor panel displays information only if the panel’s Active option is enabled. |
The following image displays the overall view of the Monitor panel:
What Information the Monitor Panel Displays
The Monitor panel includes a flexible system of settings which allows you to make the panel display only the characteristics you need. This speeds up the monitoring process and helps you avoid analyzing large amounts of information which does not serve your specific testing requirements.
By default, the Monitor panel displays two predefined data pages. The left data page lets you monitor two performance parameters - CPU and memory usage. The right one provides you with information about the total number and total size of allocated class instances.
Besides the predefined data pages, you can create your own data pages to monitor desired characteristics during profiling. For each page (including the predefined pages), you can select desired characteristics to monitor (we call them counters) and the view style.
Information on the Monitor Panel
| To learn more about … | See these topics … |
|---|---|
| Data displayed in the panel | Monitor Panel Contents |
| Working With Panel's Data Pages | Working With the Monitor Panel |
| Panel s settings | Monitor Panel Settings |
| Panel’s context menu | Working With the Monitor Panel |
| How to use Monitor panel with the Allocation profiler | Using Monitor Panel With Allocation Profiler |
See Also
Monitor Panel
Analyzing Profiler Results
Using the Monitor Panel With the Allocation Profiler


