
AQTime's user interface consists of panels, the main menu and toolbars. The general layout is as follows:

Click the image to enlarge it.
Most of AQTime's screen area is occupied by panels. Each panel serves a separate purpose in your work with AQTime. The purpose of each and how they work together is explained in a separate topic which you should read: AQTime Panels.
The size and layout of panels are not fixed. You can change panel sizes by dragging the separator between them. But the most important point about handling panels is how they can be moved around - docking. Panels are where you do your actual work and get your results in AQTime. Docking is our way of providing you with the most flexible workspace for the particular task you are interested in. It means that the entire work area can be reconfigured at will, even beyond what is possible with toolbars (moving, hiding, etc.). Docking of panels in AQTime is similar to docking windows in Microsoft Visual Studio. For complete description, see Docking.
There are common ways of arranging columns and lines in the grids, which most panels display. In addition, almost each panel has a number of options that you can modify in the Options dialog. The general organization of each panel has its own set of options, which you can modify in the User Interface dialog.
To save the current panel layout to a file, select View > Desktop > Save Docking to File from AQTime's main menu (by default, these files have the .qtdock extension). To load the panel layout from a file, select View > Desktop > Load Docking from File. To restore the default panel layout, select View > Desktop > Restore Default Docking. The Save Desktop As and Load Desktop items of the View > Desktop submenu will save and load the panel layout along with the toolbar settings.
The AQTime interface receives commands in four ways:
- through menus
- through popup menus (right-click, context-dependent)
- through toolbars
- through keyboard shortcuts
Keyboard shortcuts can be customized via the Customize Keyboard dialog. You can define your own shortcuts or select one of the predefined key mapping schemes: MS Visual Studio IDE or Borland IDE.
As in Microsoft Word or Excel, menus are a type of toolbar, and both can be customized at will. You can also create your own toolbars. By default, the Standard toolbar is docked to the top edge of the AQTime window. Other toolbars are docked to panels with which that toolbar works. For instance, the Setup toolbar is docked to the top edge of the Setup panel; the Report toolbar is docked to the top edge of the Report panel, etc. You can easily dock toolbar to any other edge by dragging them to the left, right or bottom edge of the panel. You can also dock the toolbars to any edge of the main window. See Toolbars Customization for more information.
To remove or add buttons from toolbars and menus, you can either call the Toolbar Customization window or use the Quick Customization feature. For complete overview, see Toolbars Customization.
To save or load the current layout of toolbars and toolbar items, use the View > Desktop > Save Toolbars to File and View > Desktop > Load Toolbars from File menu items. To restore the default toolbar layout, select View > Desktop > Restore Default Toolbars. To save and load the layout of panels, menus and toolbars, use the View > Desktop > Save Desktop As and View > Desktop > Load Desktop menu items.
AQTime's user interface consists of panels, the main menu and toolbars. Once AQTime has been integrated into Visual Studio, AQTime panels are listed in the Solution Explorer under the AQTime project node:

Click the image to enlarge it.
The panels are grouped by their role in your AQTime project. Panels are where you do your actual work and get your results in AQTime. Every panel serves a different purpose. For more detailed information on the different purposes and on how the panels work together, see AQTime Panels.
To bring up a panel, either select it in the Solution Explorer; or select AQTime > Panel List from Visual Studio's menu and then choose the panel from the ensuing Select Panel dialog (the AQTime menu item is also added by AQTime. See below).
You can change the panel size and location in the same way you would with other Visual Studio windows. There are common ways of arranging columns and lines in the grids, which most panels display. In addition, almost each panel has a number of options you can modify in the Tools > Options dialog of Visual Studio.
The AQTime > Toggle Panels menu item lets you quickly hide or display AQTime panels. If there are visible AQTime panels, then pressing this item will hide them. If there are no visible AQTime panels, pressing this item will show the panels that were visible at the moment of hiding.
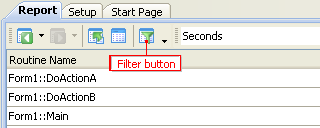
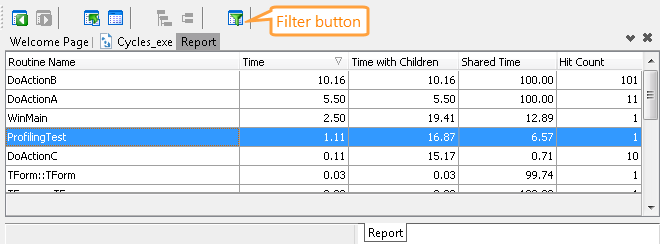
Most panels have a toolbar at the top. The toolbar items allow you to perform certain operations over data displayed in panels. For instance, the  Filter item of the Report toolbar displays the Filter dialog where you can create a filter condition and apply it to profiler results:
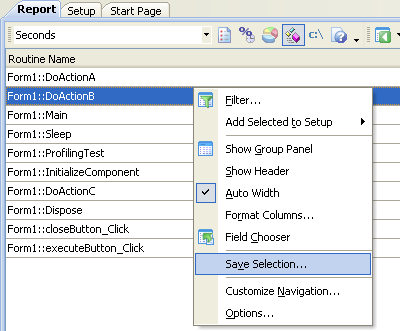
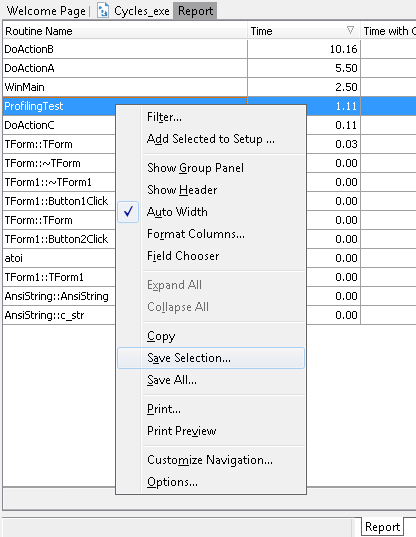
Even more operations are available in the context menu for each panel. For instance, the context menu of the Report panel holds the Save Selection item that exports profiling results to text, Excel, html or xml files:
You can dock a "panel" toolbar to any side of the panel that holds this toolbar. There is also a way to hide or display items of these toolbars. For more information, see Toolbar Customization. Unlike toolbars, the panels' context menus are not customizable.
Besides the "panel" toolbars, AQTime also adds one more toolbar, AQTime Standard, to Visual Studio. You can display this toolbar by right-clicking somewhere in the toolbar area and checking AQTime from the subsequent context menu. The toolbar holds the following items:
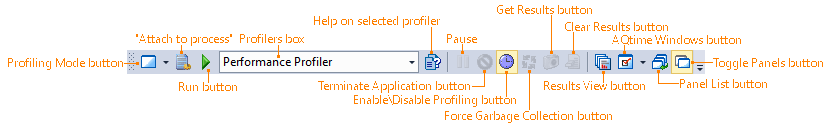
The toolbar items are displayed or hidden depending on the current context. For instance, the  Terminate item will not be visible until you start profiling.
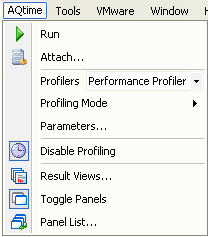
AQTime also adds the AQTime menu item to Visual Studio's main menu. This menu holds the same items as the AQTime Standard toolbar.
In addition to the AQTime menu, AQTime inserts several items to the Project menu:
You can manage the AQTime and Project menus and the AQTime Standard toolbar in the same manner as you manage other Visual Studio menus and toolbars.
AQTime's user interface consists of panels, the main menu and toolbars. Once AQTime has been integrated into Embarcadero RAD Studio XE6 - XE8 and 10 - 10.3, all these elements of AQTime’s user interface are displayed within the Borland Developer Studio (or RAD Studio) environment.

Click the image to enlarge it.
The panels are grouped by their role in your AQTime project. Panels are where you do your actual work and get your results in AQTime. Every panel serves a different purpose. For more detailed information on the different purposes and on how the panels work together, see AQTime Panels.
To bring up any of AQTime’s panels, select it in the AQTime Profile Windows submenu of Embarcadero RAD Studio’s View menu.
You can change the panel size and location in the same way you would with other Embarcadero RAD Studio windows. There are common ways of arranging columns and lines in the grids, which most panels display. In addition, almost each panel has a number of options you can modify in the Options dialog.
Most panels have a toolbar associated with them. These toolbars are displayed at the top of the Embarcadero RAD Studio window. The toolbar items allow you to perform certain operations with data displayed in panels. For instance, the Filter item of the Report toolbar displays the Filter dialog where you can create a filter condition and apply it to profiler results:
The toolbar items are displayed or hidden depending on the current context. For instance, the Terminate item will not be visible until you start profiling.
Even more operations are available in the context menu for each panel. For instance, the context menu of the Report panel holds items (Save Selection and Save All) that are useful for exporting profiler results to text, Excel, html or xml files:
There is a way to hide or display items of these toolbars. For more information, see Toolbar Customization. Unlike toolbars, the panels’ context menus are not customizable.
AQTime also adds the AQTime menu item to RAD Studio’s main menu. This menu holds the items that let you start and stop the profiling, specify the current profiler type and parameters, get profiling results, open the Options dialog used to configure AQTime’s general options which are not specific to a particular AQTime project:
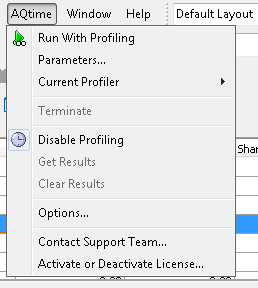
The Run With Profiling menu and toolbar command starts profiling your modules with the selected AQTime profiler. An alternative way to start profiling is to choose Run from the IDE’s Debug menu.
The Run With Profiling command is available even when an AQTime project is not added to the current project group, in this case AQTime creates a new project and starts profiling immediately.
See Also
Docking
Toolbars Customization
User Interface Dialog
Customize Keyboard Dialog