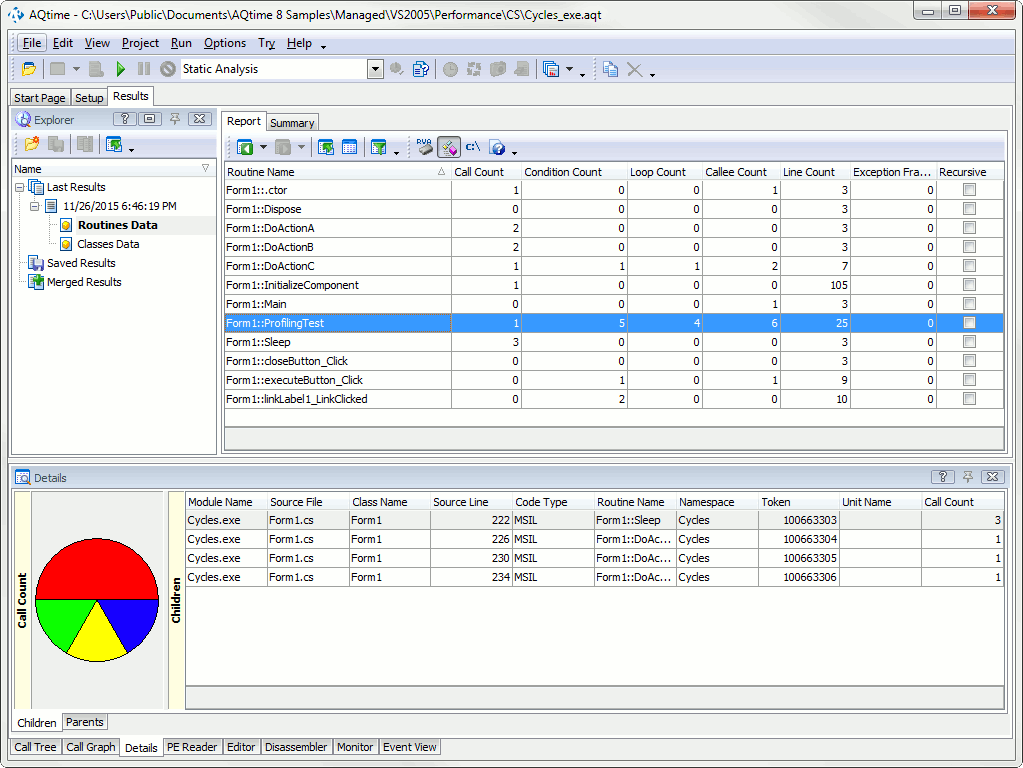
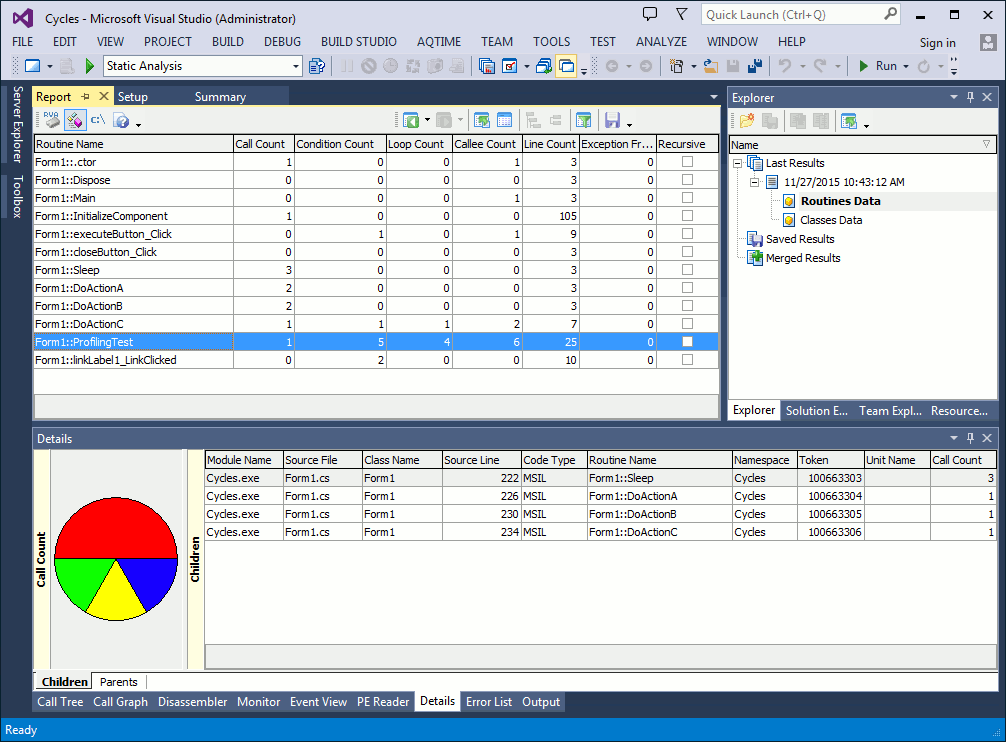
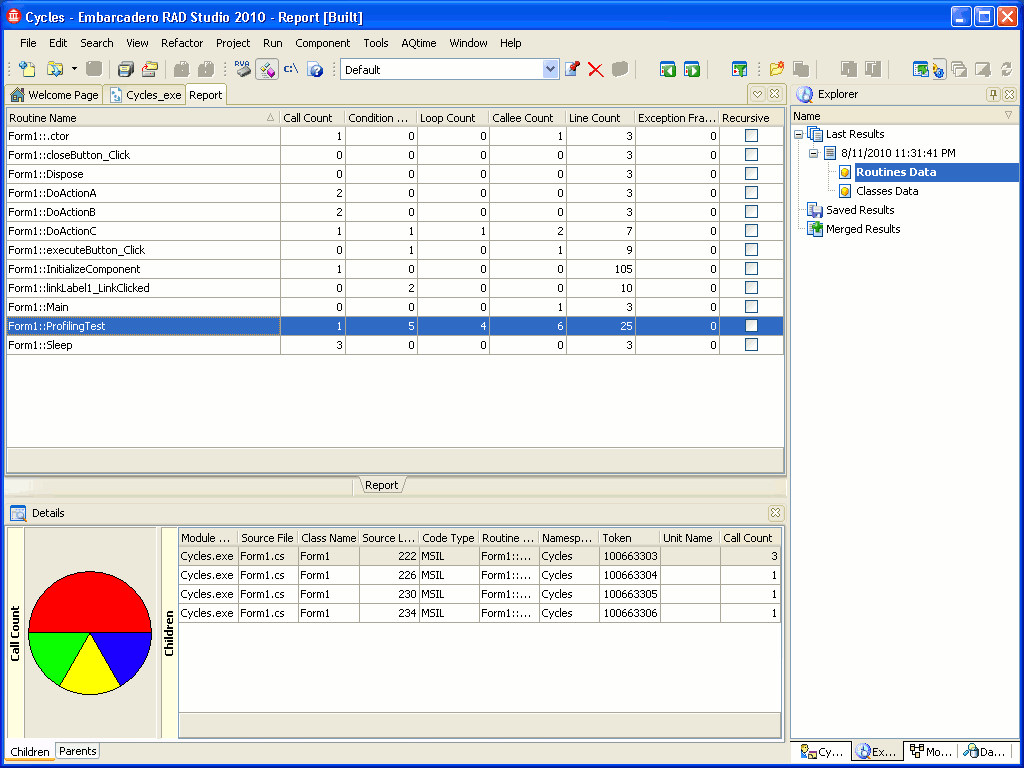
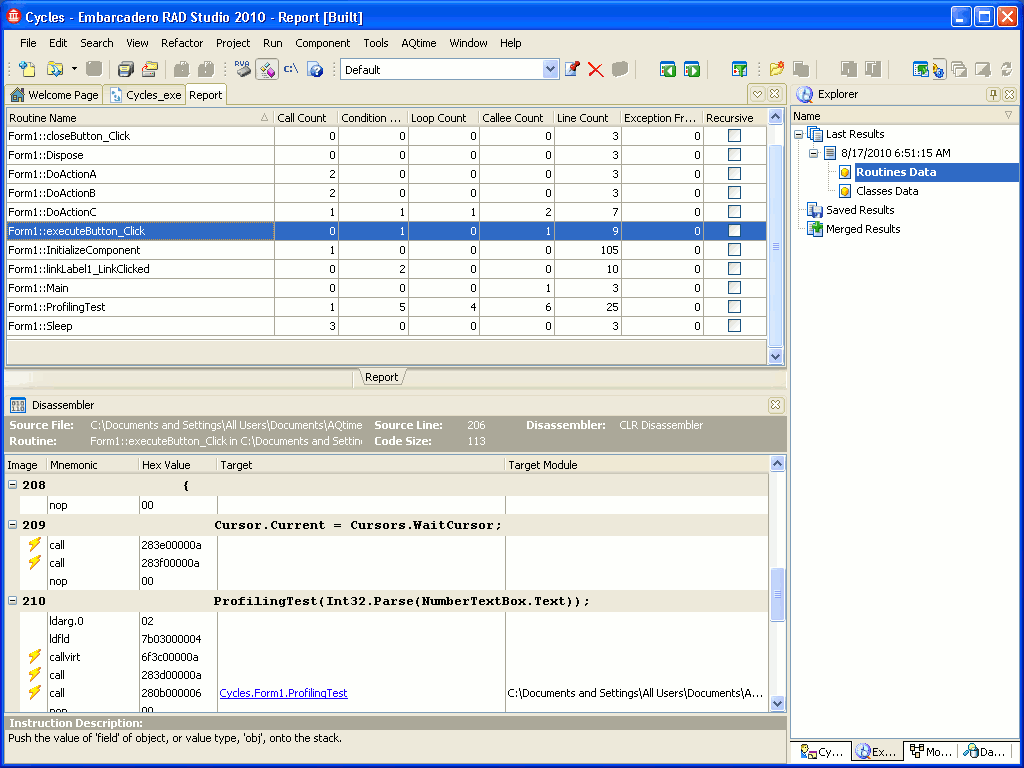
Here is a sample output of the Static Analysis profiler:
As you can see, profiling results are organized into categories that are shown in the Explorer panel. Select the Routines Data category.
When this category is selected, the Report panel displays information about routines in the profiled module(s). Each row in the panel correspond to a routine. Routine’s attributes and characteristics are shown in the panel columns. For instance, looking at the Recursive column you can quickly determine whether a routine calls itself.
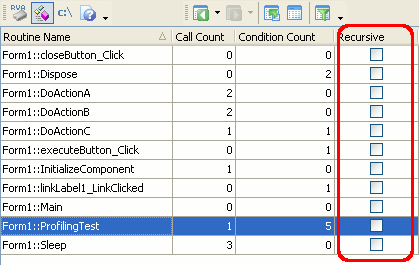
Note that by default the Report panel does not show all available columns. To add columns to the panel, select  Field Chooser from the context menu and then drag the desired column to the panel. See Adding and Removing Columns for more information.
Now let’s isolate the longest routine in our sample program:
- Add the Code Size column to the panel (if the column is not visible). This column displays the routine size in bytes. For more information on how to add columns, see Adding and Removing Columns.
- Sort panel contents on the Code Size column (to do this, simply click the caption of the column). The arrow in the column caption will indicate the sorting order (ascending or descending).
- According to the sorting order, scroll the panel up or down. The topmost (or the lowest) row in the panel will hold the largest routine in source code lines.
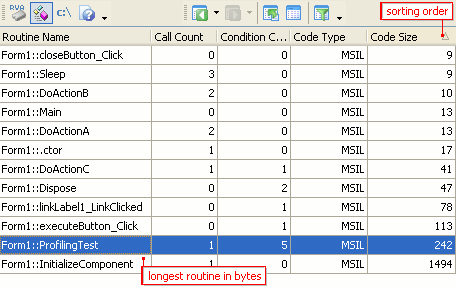
To find the largest routine in source code lines, sort profiling results on the Line Count column.
For more information on working with profiler results, please see Sorting Columns, Grouping Columns and Searching Results.
To display only managed (.NET) or unmanaged (native, non-.NET) routines, filter profiling results on the Code Type column. This column identifies the type of the application binary code. For instance, let’s filter profiling results to display managed code only. To do this, we will use “auto-filtering”:
- Add the Code Type column to the Report panel (see Adding and Removing Columns for more information on how to do this).
- Then, press the dropdown button in the caption of that column and select MSIL from the dropdown list (this value is available only for managed code samples). AQTime will filter rows in the Report panel and it will display only managed routines.
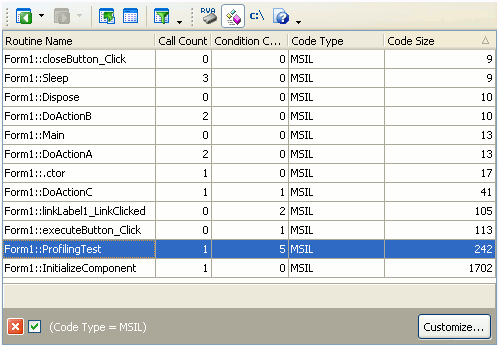
An alternative to auto-filtering is creating and applying a filter expression in the Filter dialog. For more information on how to filter profiling results in AQTime, see Filtering Results.
To show managed or unmanaged code, you can also use two result views: .NET-code routines and classes and Native-code routines and classes. The first results view will filter profiling results so that they will include only managed routines. If you select the second results view, AQTime panels will show only unmanaged routines. To apply a view, simply select it from the View > Result Views menu or from the Result Views dropdown list on the Standard toolbar.To apply a view, select the AQTime > Views menu item and then choose the desired view in the ensuing Result Views dialog.To apply a view, click the  Result Views button and then choose the desired view in the ensuing Result Views dialog. Note that this button does not reside on any toolbar by default. However, you can add the button to any RAD Studio’s toolbar via the Toolbar Customization dialog. In this dialog, switch to the Commands page, select the View.AQTime category in the Categories list, drag the Result Views command from the Commands list and drop it on the needed toolbar.
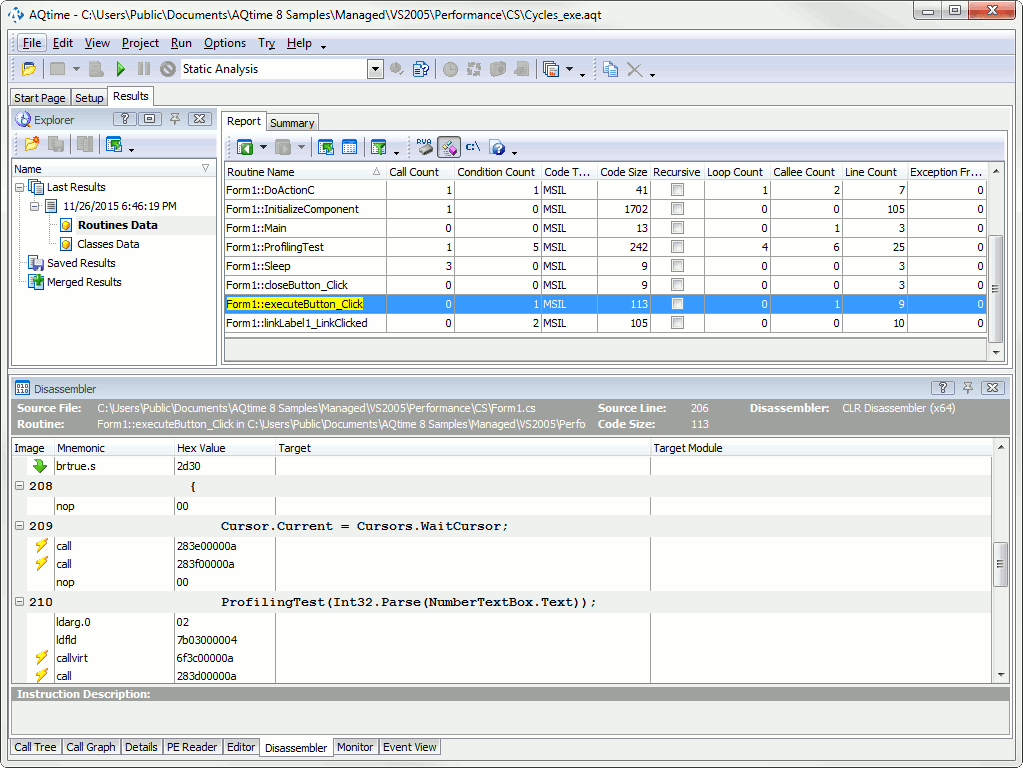
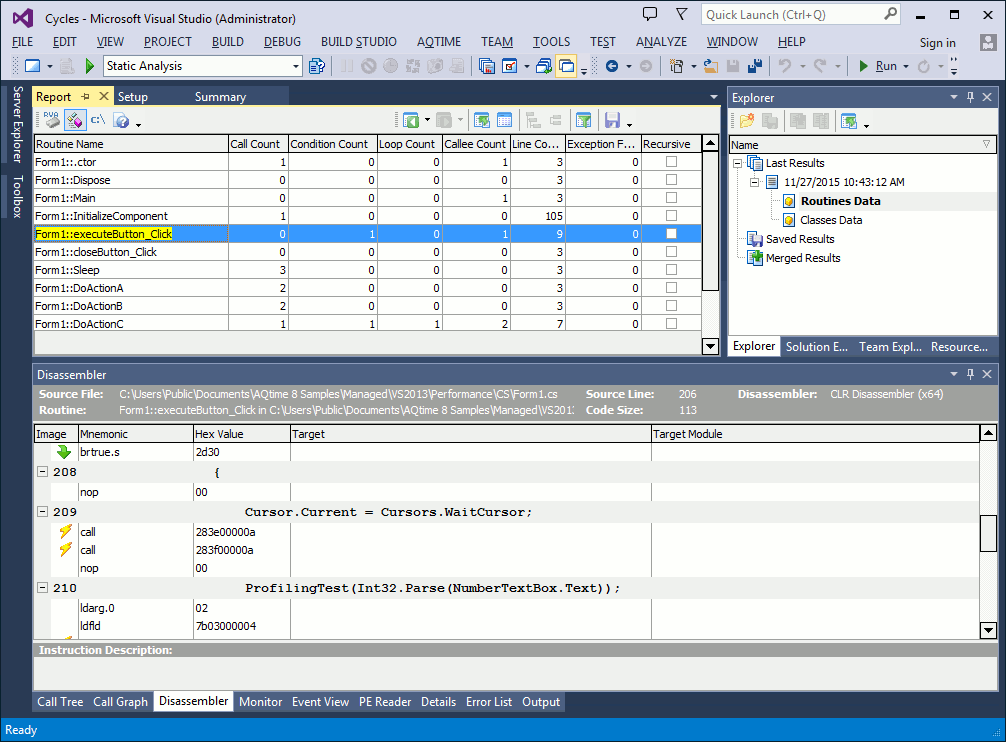
To analyze binary code of a routine, use AQTime’s Disassembler panel: select the desired routine in one of AQTime panels (Report, Details, Setup, etc.) and then switch to Disassembler. The panel can display the routine’s disassembly with corresponding source code lines and allows you to navigate through binary code easier. Note that the Disassembler panel supports both managed and unmanaged (native) code. Let’s view the binary code of the Form1::ExecuteButton_Click function:
- Disable the current filter by clicking the x button at the bottom of the Report panel.
- Select the
Form1::ExecuteButton_Clickfunction in the Report panel. You can do this by focusing the Routine Name column in the Report panel and typing Form1::ExecuteButton_Click (if the Routine name with class name button on the Report toolbar is not pressed, skip the class name, that is, type ExecuteButton_Click). AQTime will search for the routine while you are typing the routine name. You can also find the routine by using the Find dialog. For more information on searching for routines in the Report panel, see Searching Results. - After the function is found in the Report panel, AQTime updates its panels (including the Disassembler panel) so that they will display information concerning the function
. Switch to the Disassembler panel to view the binary code of the selected routine:
At the next step we will explore links between routines and classes.

 Prev
Prev