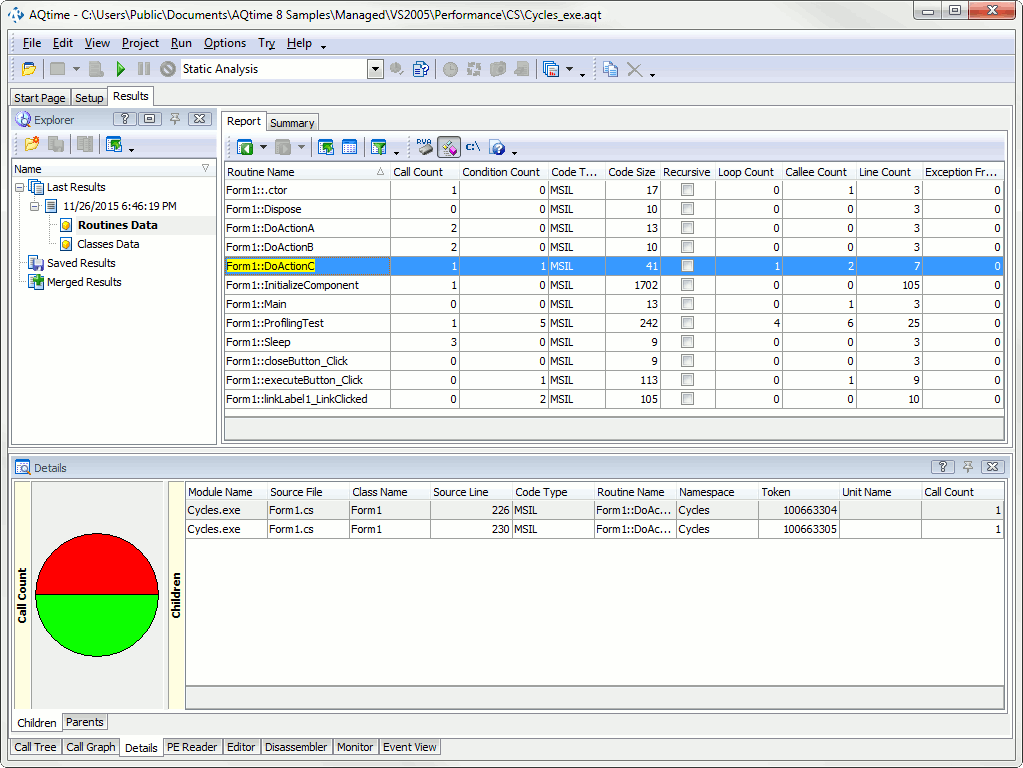
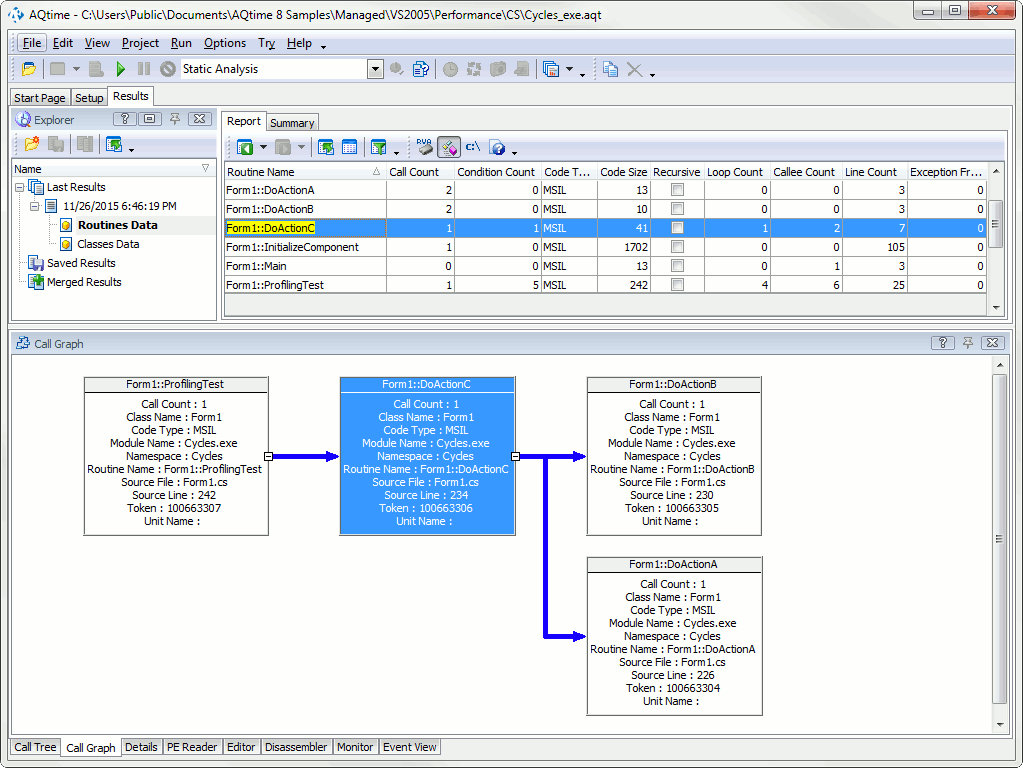
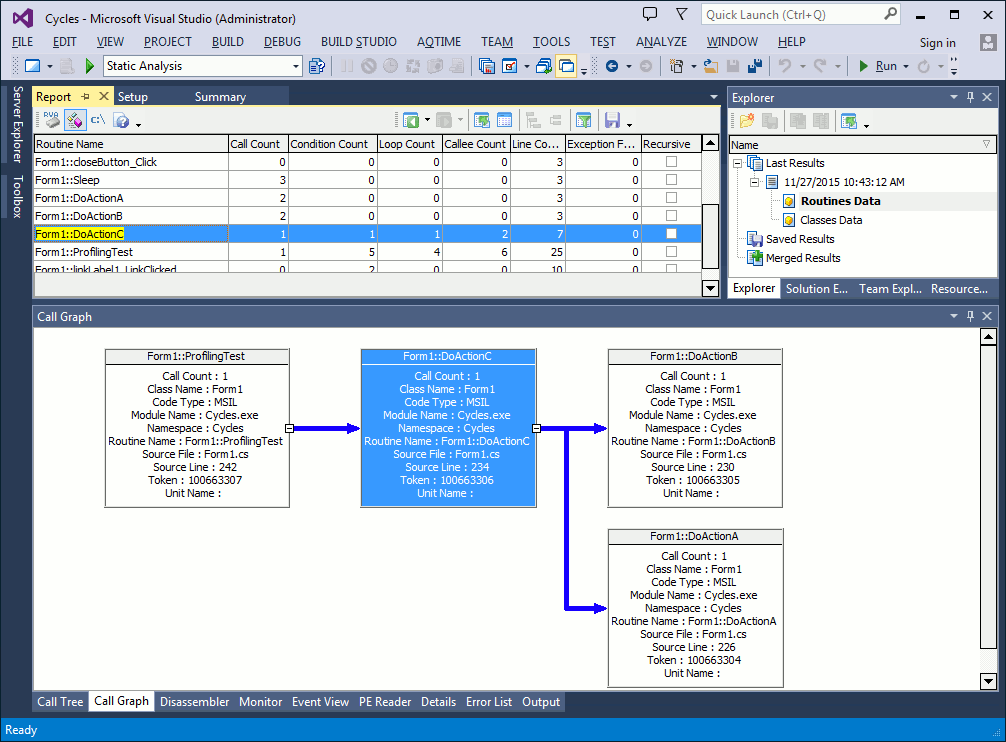
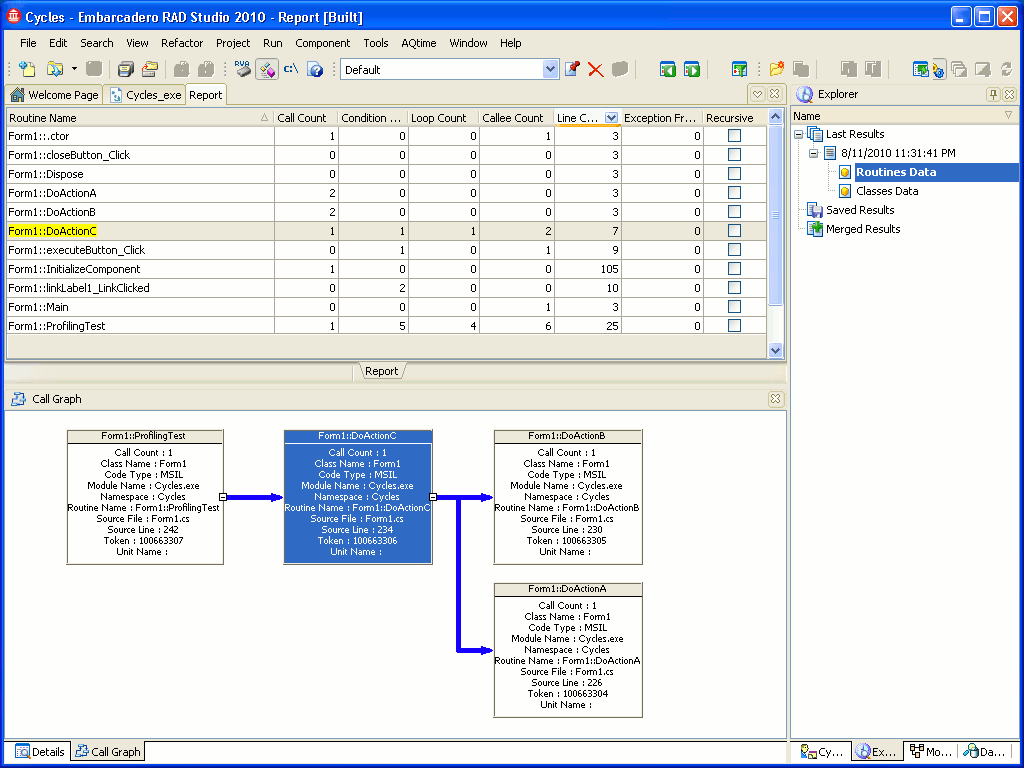
Besides displaying such information about routines as size of binary code, size in source code lines, code type, etc. the Static Analysis profiler also traces and displays information on links between routines and links between classes. For example, let's find which routines call the DoActionC routine in our sample application and which routines DoActionC calls:
- Make certain that the Routines Data category is selected in the Explorer panel.
- Locate
DoActionCin the Report panel. You can do this, for example, by focusing the Routine Name column in the Report panel and typing Form1::DoActionC (if the Routine name with class name button on the Report toolbar is not pressed, skip the class name, that is, type DoActionC). AQTime will search for the routine while your are typing. You can also find the routine by using the Find dialog. For more information, see Searching Results. - After
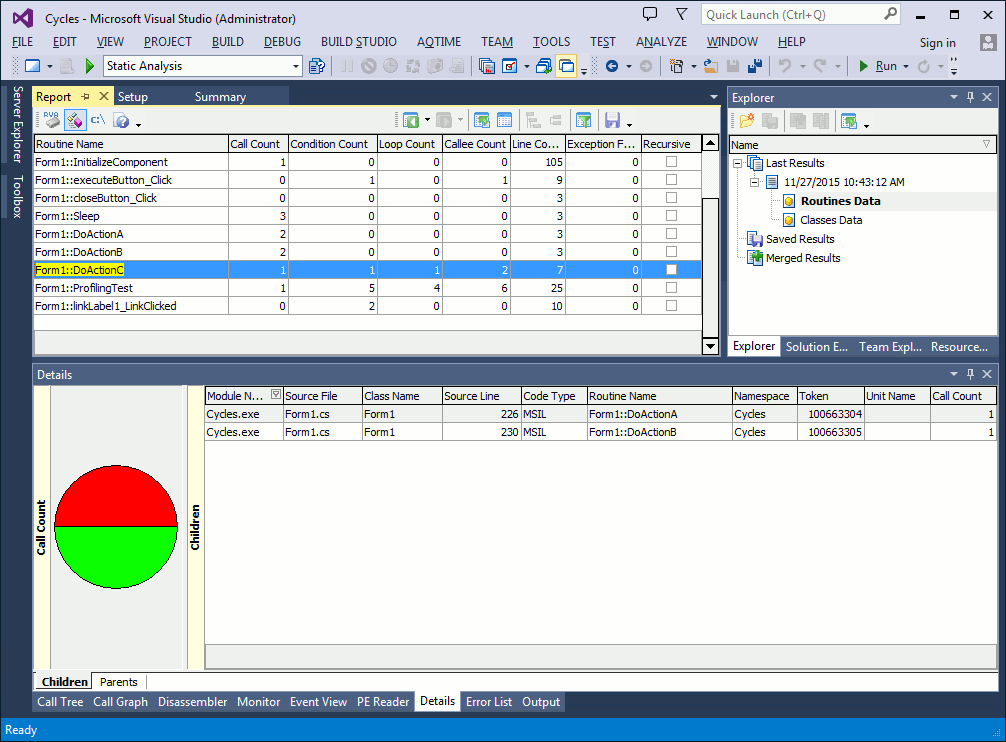
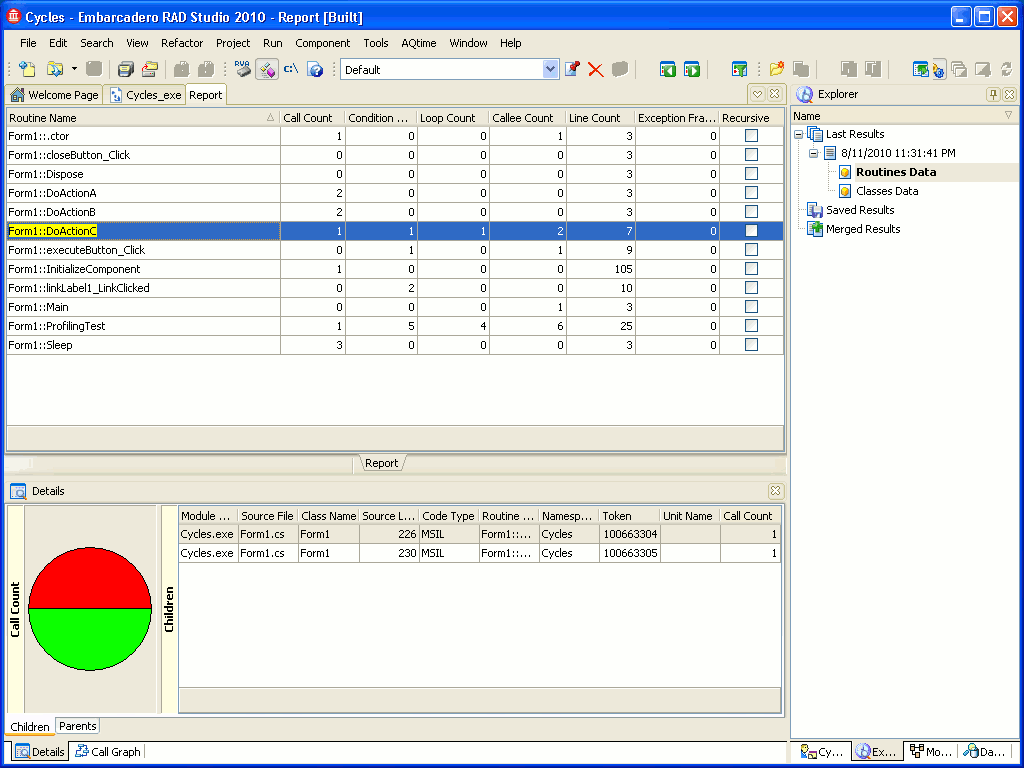
DoActionCis found in the Report panel, AQTime will update other panels so that will displaying information concerningDoActionC. Switch to the Details panel. The Parents table in this panel displays routines which callDoActionC. The Children table shows routines whichDoActionCcalls.As you can see, besides routine names, these tables show information that will help you locate parent and child routines in source code. The Call Count column of the Parents table shows the number of times a parent routine call
DoActionCand the Call Count column of the Children table shows the number of timesDoActionCcalls each child routine.
Note that these are potential calls. The actual number of calls can be measured only during application execution. The Static Analysis profiler does not launch the application under test, so it can report about potential calls only. If a child function, is called in a loop or within the if then statement, the actual and potential number of calls will differ.
If you double-click a routine in the Parent or Children table, AQTime will update its panels so that they will display information for the clicked routine. For instance, the Details panel will show information on parent and children functions for that routine.
To browse the hierarchy of function calls, you can use the Call Graph and Call Tree panels. For example:
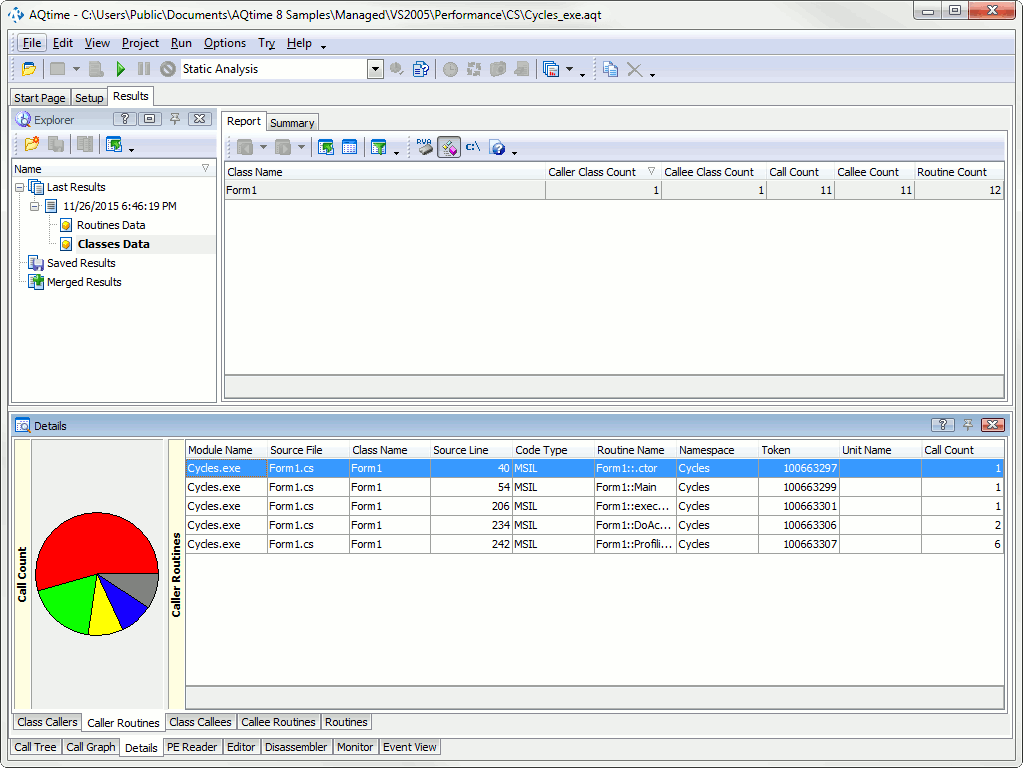
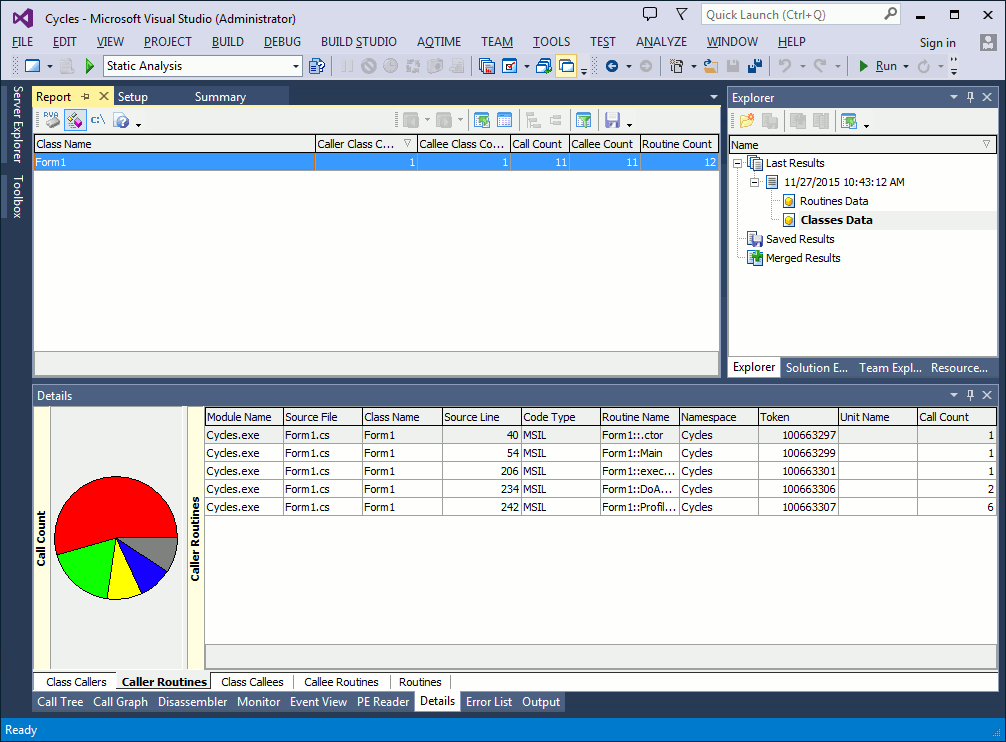
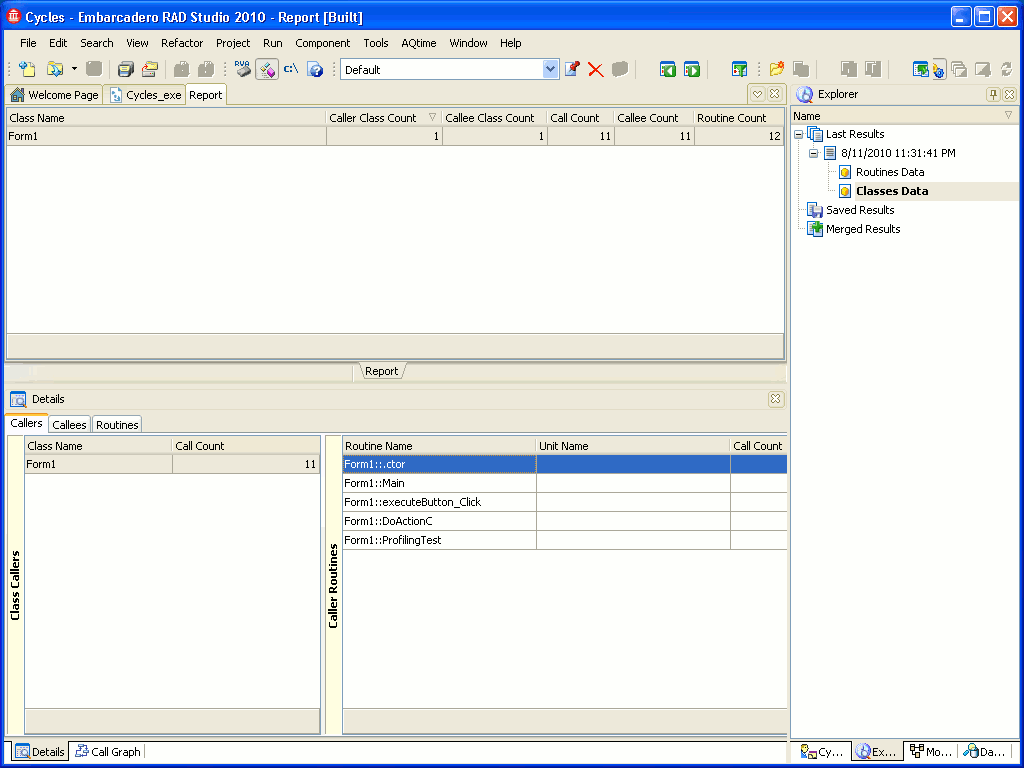
To view call relationship between classes (what methods of a class call methods of another class):
-
Select the Classes Data category in the Explorer panel.
-
Select the desired class in Report and then switch to the Details panel.
-
The Class Callers table of the Details panel contains classes whose methods call methods of the selected class. The Caller Routines table contains the names of caller methods. The Class Callees table contains classes whose methods are called by methods of the selected class, and the Callee Routines table contains the names of callee methods.
The Static Analysis profiler offers two result views, Leaf routines (classes) and Non-leaf routines (classes), and that let you easily see only those routines or classes that have or have no callees. To apply a view, simply select it from the View > Result Views menu or from the Result Views dropdown list on the Standard toolbar.To apply a view, select the AQTime > Views menu item and then choose the desired view in the ensuing Result Views dialog.To apply a view, click the  Result Views button and then choose the desired view in the ensuing Result Views dialog. Note that this button does not reside on any toolbar by default. However, you can add the button to any RAD Studio’s toolbar via the Toolbar Customization dialog. In this dialog, switch to the Commands page, select the View.AQTime category in the Categories list, drag the Result Views command from the Commands list and drop it on the needed toolbar.

 Prev
Prev