After the profiling run is over, AQTime displays detailed information about profiling results. The following sections provide a brief overview of results and panels that hold them and explain how to filter results.
Viewing Summary Profiling Results
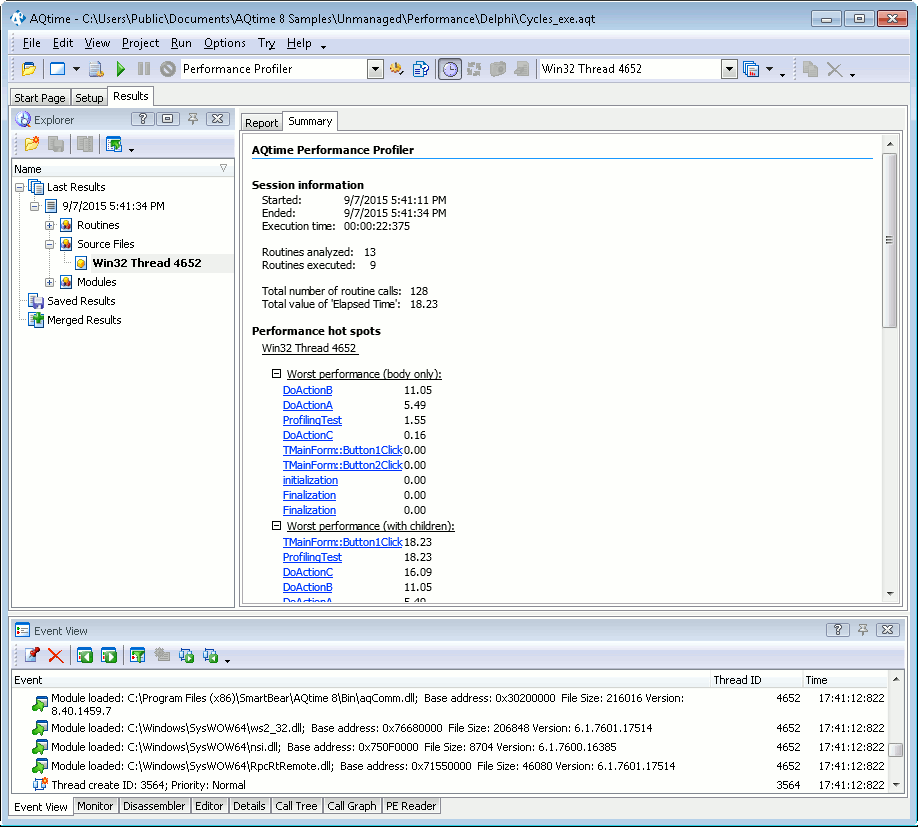
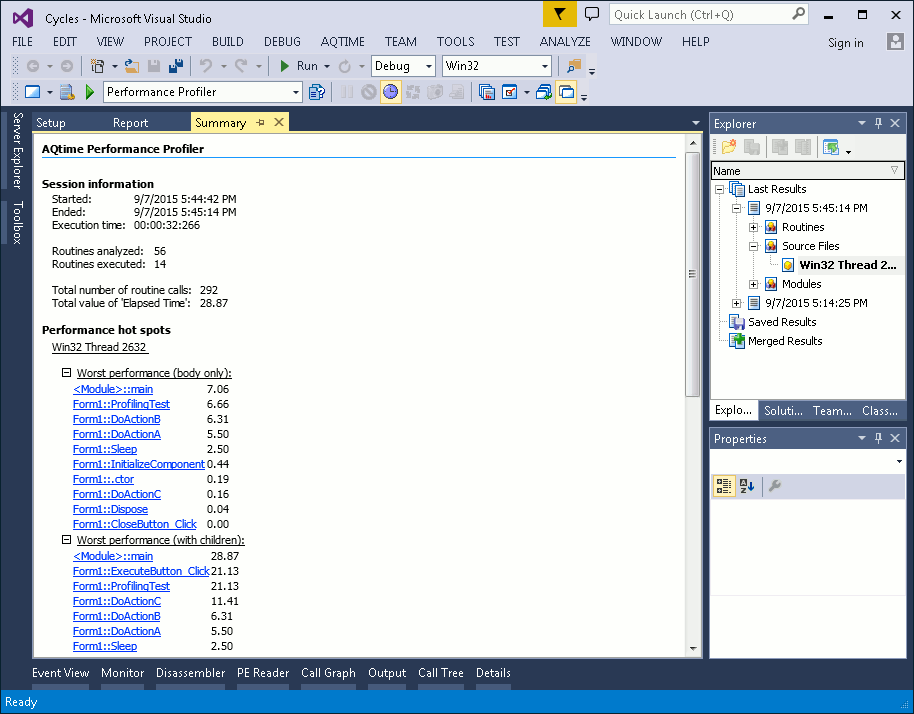
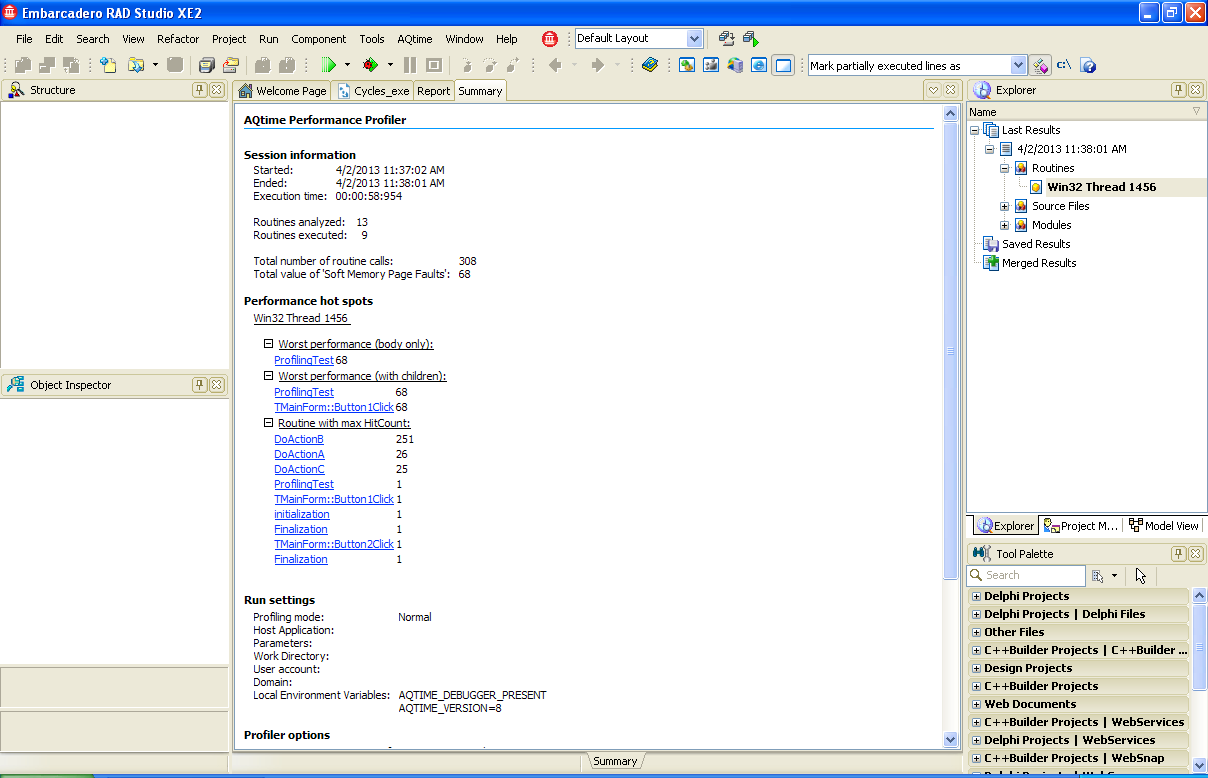
The Summary panel displays the summary results for the whole profiler run regardless of the selected category.
Use this panel to quickly find routines that are performing poorly. The contents of the other panels depend on the currently selected category.
Viewing Detailed Information
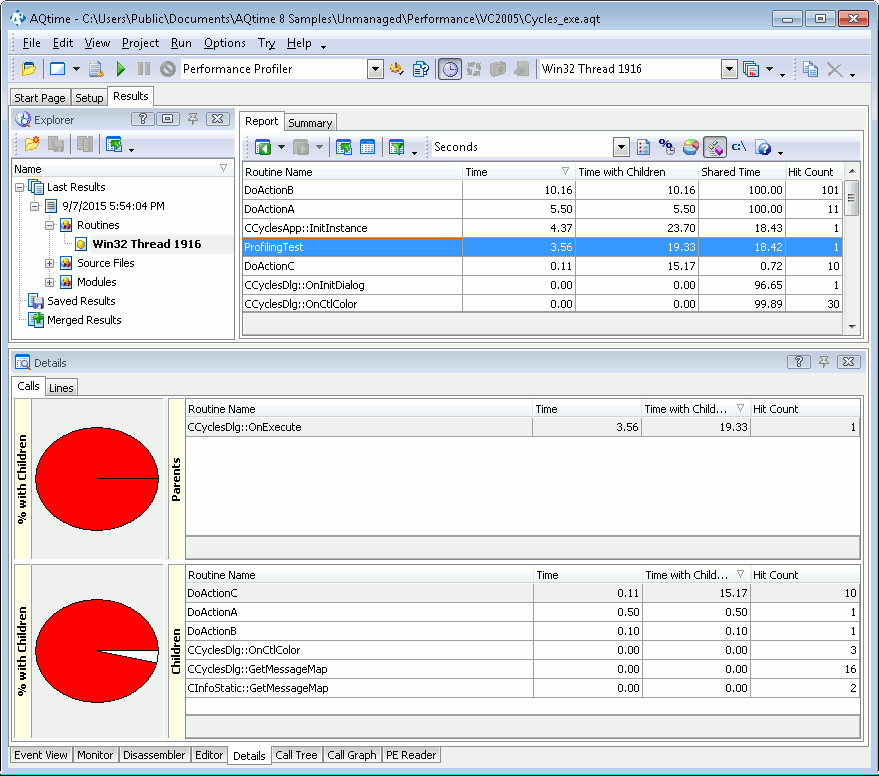
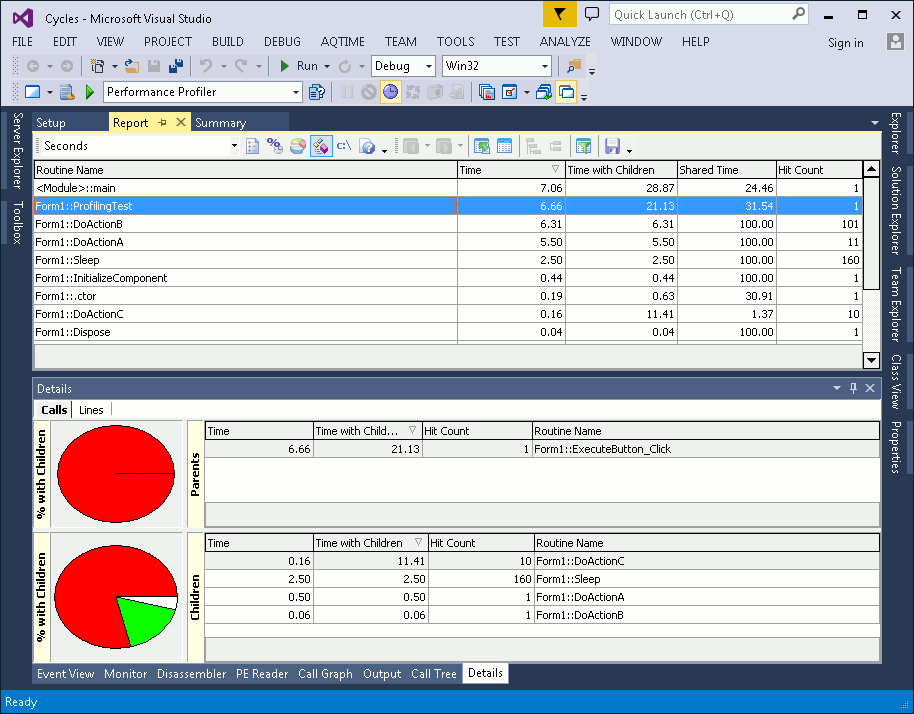
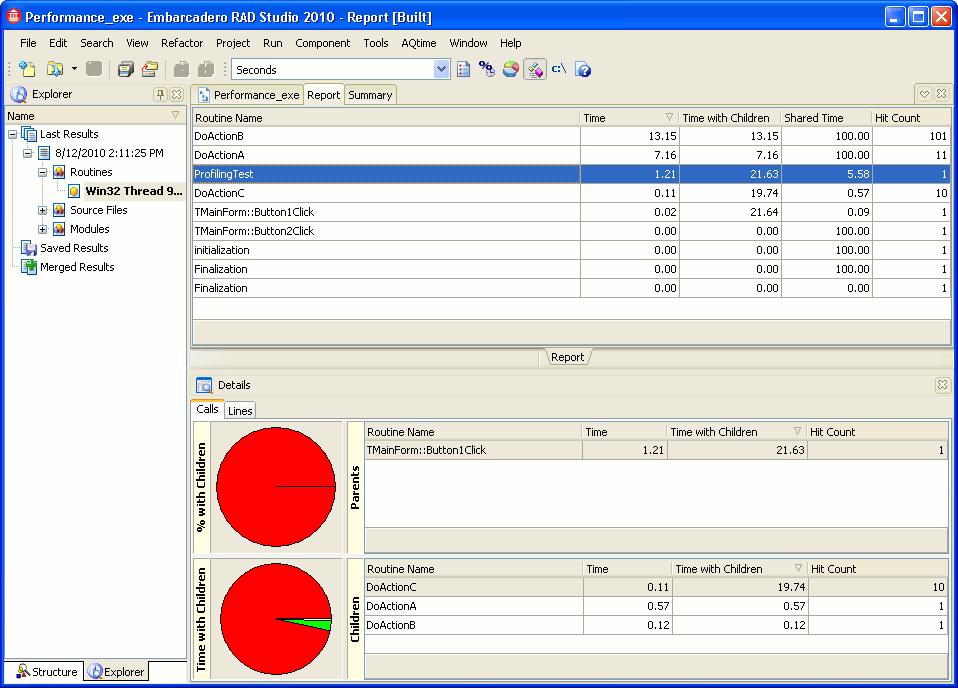
The Performance profiler monitors all the method calls in your application, counting the calls, tracing the call hierarchy (what called what), etc. thread by thread. Profiling results for individual application routines, source files and modules are displayed in the Report panel.
Below is a sample output of the Performance profiler:
The profiling results are organized into three categories: Routines, Source Files and Modules. Source Files and Modules let you view summary profiling results for each source file and module in your application. The Routines category contains results for each single routine that was included in profiling tasks.
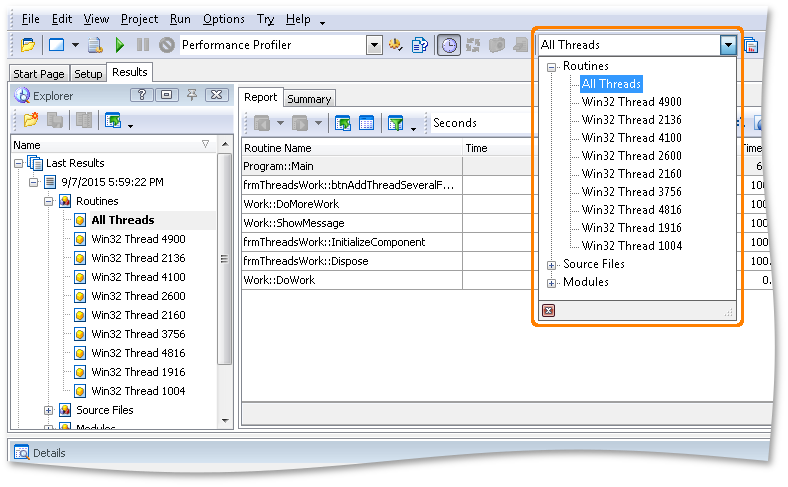
Within the categories, the results are grouped by threads. There is also the All threads group that shows profiling results for all the threads. You can also select the desired category and thread from the Result Items box:
After you chose the desired category, AQTime will update the Report panel. The contents of this panel depend on the currently selected category:
-
Routines
If selected, the Report panel displays profiling results one routine per line. Line timing results are displayed in the Lines page of the Details panel and in the Editor’s grid. in the Code Editor’s grid. in the Editor’s grid. The Report panel is the “main” results display. Other AQTime panels, such as Details, Call Graph or Call Tree, hold additional results for the routine selected in the Report panel.
We would like to note that to profile code at the line level, you should add desired routines, classes, files or modules to a line-level profiling area (see Profiling Levels). Also, to profile managed routines at the line level, you have to compile the application with debug information (see How AQTime Profilers Use Metadata and Debug Information).
For a detailed description of the results displayed under the Routines category, see Results of the Routines Category.
-
Source Files
If selected, each row in the Report panel shows profiling results for a source file. The other panels that provide additional information on profiling results are not used.
For a detailed description of the results displayed in the Source Files category, see Results of the Source Files Category.
-
Modules
If selected, each row in the Report panel displays profiling results for one application module. The other panels that provide additional information on profiling results are not used.
For a detailed description of the results displayed in the Modules category, see Results of the Modules Category.
How to Filter Results
You can modify the results that are currently displayed as your needs dictate:
-
If you use the Elapsed Time, User Time or User+Kernel Time counter, use the Counter unit box to select the unit of time measurement for “time” columns (for example, Seconds or Machine Cycles).
- Another toolbar item,
 Show non-hit routines, lets you easily include or exclude non-executed routines from the result display. For more information on the toolbar items, see Profiler Toolbar - Performance Profiler Items.
 -
The column footer shows summary results for the values displayed in that column. You can customize the summary type and summary format using the Format Columns dialog. For instance, you can select one of the five summary types (Sum, Count, Avg, Min, Max) or you can hide the summary for the column.
-
You can also group results by any column. When you group results by a column, besides “global” summaries shown at the footer of the panel, AQTime displays “local” summaries at the end of each group node. For instance, grouping results by the Class column helps you find the total time spent executing all class methods (the summary for the Time column should be enabled). For more information on how to group, sort, filter and search profiling results, see Analyzing Profiler Results.
Important Notes
-
Calls to child functions are timed (and deducted from the Time total) only if the child functions are part of the profiling areas. Otherwise, they count in the execution time of the parent function (“own code”). You may misidentify bottlenecks unless you make sure that the child functions are profiled along with their parents (callers). Triggers may help you do this without profiling everything during the run. See also Profiling Child Routines Along With Parents.
-
The Performance profiler results may include the <Root>, <JIT compiler> and <Garbage collector> pseudo-routines. These are fictitious routines, they do not exist in your application. <Root> is used as a parent routine of the topmost level; <JIT compiler> and <Garbage collector> help you figure out the time spent on JIT compilation and garbage collection. See Pseudo-Routines in Profiling Results for more information about these functions.
By default, this item is hidden. To add it:
-
Right-click any AQTime toolbar and select Customize from the context menu.
-
In the Customize dialog, open the Commands tab and select the Standard category.
-
Drag the Result Items command to the desired toolbar and then close the dialog.
See Also
Performance Profiler - Overview
Analyzing Profiler Results
Calculating Percent in the Report Panel
Comparing Results
Merging Results
Profiling .NET Applications - Specifics

 Viewing Summary Profiling Results