The Performance profiler includes a  Calculate % with children relative to real values option that is displayed on the Profiler toolbar. This option affects how the % with children values are calculated in the Report panel.
This option was primarily designed for the timing counters (Elapsed Time, User Time and User+Kernel Time). That is why in further explanations we will only mention the “Time” columns. However, the description can be extended on other counters, since their results are similar to the results of the timing counters.
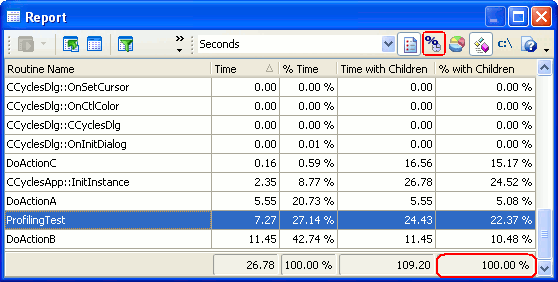
In the default state the option is disabled, so % Time is the Time value as a percentage of the total of all Time values (as shown in the footer of the Time column). Likewise % with children is the Time with Children value as a percentage of the total of all values in that column. The total in the footer of % with children is 100%. For instance:
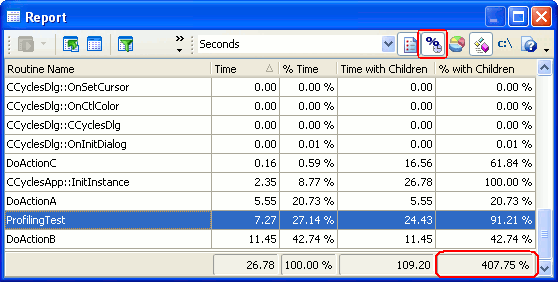
When the option is enabled (the  box is pressed), % with children is the Time with Children value as a percentage of the total of all values in the Time (not Time with children) column. Normally, this will yield a total in the footer of the % with children column much greater than 100%, as child time is being added in more than once (see the image below). The advantage of the setting is that % with children tells you what any profiled function costs, child calls included, as a proportion of the total profiled time. That is, for timing counters, “% with children relative to real values” is shorthand for “% relative to total time spent profiling”.
When results are stored, they are stored with the current column contents. % with children will not change when you retrieve the results, no matter what the current setting for % with children relative to real values. You can easily see under what setting the results were generated by checking the footer for % with children. If it is 100%, then the option was off. If it is greater, the option was on.


