In order to profile your application with AQTime you may need to compile it with debug information. This depends on your application type: unmanaged (or native-code, non-.NET) or managed (.NET or Java) application.
| Note: | AQTime is not compatible with applications that perform non-standard actions over binary code or over a stack. For more information, see Unsupported Code. |
Native-code (unmanaged) applications
In order to profile native-code applications with AQTime, such applications must be compiled with debug information. Debug info tells AQTime where the routines start and end in memory, what the routine size is (in bytes), where each routine is located in the executable’s memory, etc. For complete information on how to compile your application with debug info, see Compiler Settings for Native Applications.
When your application is ready for final delivery, remember to compile it without debug info to reduce the application size.
.NET applications
Generally, .NET applications already have all the information necessary for profiling as represented by its metadata. However, metadata holds no information about links between source files and an application’s internals (types, classes, members etc.) This limits some AQTime features. For example, the Editor panel does not display the source code for the routine selected in the Report panel. Another limitation is that you cannot profile routines at the line level (see Profiling Levels).
The above limitations are eliminated when you include debug information to your application executable and AQTime will use the debug information as an addition to the existing .NET metadata information. To learn how to add debug information to your .NET applications, see Compiler Settings for .NET Applications.
When your .NET application is ready for final delivery, remember to compile it without debug info to reduce the application size.
| Note: | If your managed application includes portions of unmanaged code, you should compile it with debug information in order for AQTime to be able to profile the unmanaged code. |
Java Applications
You can typically profile Java applications out-of-the-box, without preparing the application is a special way. This is possible since the Java bytecode includes information about the application’s internals - packages, classes, methods and so on. In addition, the Java compiler includes debug information in Java applications by default, so AQTime is able to link profiling results to the source code elements.
However, it is possible to compile applications without debug information or with partial debug information (for example, source file information may be included, but line number information will not be generated). In this case, the profiling features will be limited. For example, you will not be able to profile routines at line level and see the source code of the application’s routines in the Editor.
To eliminate the above-mentioned limitations, you need to compile your Java application with debug information. AQTime will use this debug information along with the bytecode information when profiling your application and generating results. To learn how to include debug information in Java applications, see Compiler Settings for Java Compiler.
| Note: | To profile mixed Java applications, which include both Java and native code, you must also compile native code with debug information as described above. |
When your Java application is ready for the final delivery, remember to compile it with the original settings you use for release modules.
Debug Information Benefits
Let’s reiterate that AQTime profiles routines at the line level only if the application was compiled with debug information. In addition to Line Level profiling, debug information provides other benefits:
-
The Editor panel displays the source code when you double-click a routine in the Report or Details panels or the Modules pane of the Setup panel.
-
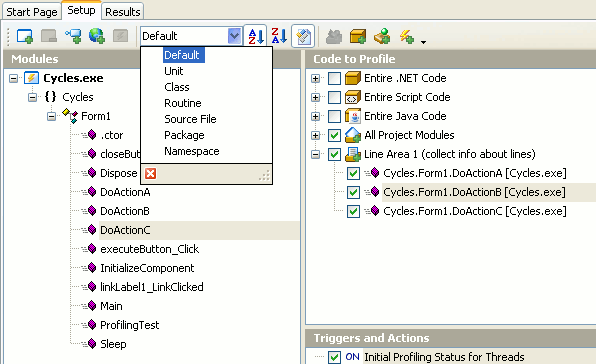
The Setup panel lets you navigate through the application not only by namespace and class but also by file:

-
For some profilers, the Report and Details panels will show the Source File and Source Line columns. These columns are filled with data obtained exclusively from the application’s debug info. They help you locate a routine in your source quickly.
Use the Symbols Options dialog to enable or disable debug readers, which AQTime uses to parse debug information and metadata. In the dialog, you can also specify the search paths for debug info files that are generated separately from the executables.
