The Editor panel displays the source code of the profiled modules.
When you double-click a routine in the Setup, Summary, Report, Details, Call Graph, Call Tree, PE Reader or Event View panel, the Editor panel automatically updates its contents to display the routine’s source code.
If AQTime is integrated into Microsoft Visual Studio, AQTime’s Editor panel is not available. You can view the source code of the profiled modules in the Code Editor, which is Visual Studio’s native text and code editor. AQTime extends the functionality of the Code Editor to provide interaction with AQTime panels and to display the profiling results along with the source code.
When you click a routine in the Setup, Summary, Report, Details, Call Graph, Call Tree, PE Reader or Event View panel, AQTime updates the Code Editor to display the source code of the clicked routine.
If AQTime is integrated into Embarcadero RAD Studio, AQTime’s Editor panel is not available. You can view the source code in Embarcadero RAD Studio’s native text and code editor. AQTime extends the functionality of RAD Studio’s editor to provide interaction with AQTime panels and to display profiling results along with the source code.
When you click a routine in the Setup, Summary, Report, Details, Call Graph, Call Tree, PE Reader or Event View panel, AQTime updates the Editor to display the source code of the clicked routine.
Viewing Profiling Results
In the Editor panel, you can view profiling results along with the source code of the profiled modules.

Editor Panel Grid
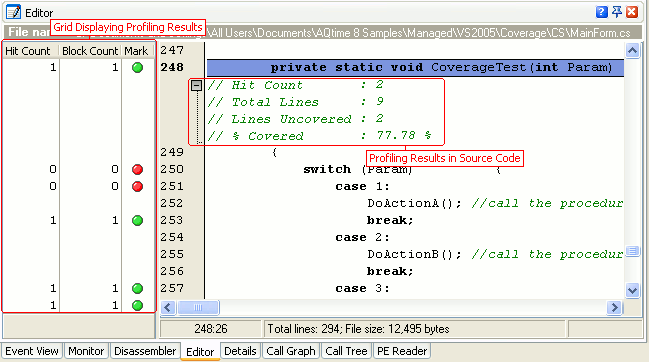
If any of your application routines were profiled at line level, the Editor panel contains a grid on its left side. The grid displays profiling results for routines and source code lines.
The grid contains the same set of columns as the Lines table of the Details panel.
The grid’s footer can display a summary value for selected rows. If there are no rows selected, the footer shows summary for all rows.
Viewing Profiling Results Directly in the Source Code
The Editor panel can display profiling results for routines in source code. The results are displayed as comments before the routine’s source code.
To specify the results to be displayed in these comments, use the Customize Comments dialog, which is called by selecting Customize Comments from the Editor’s context menu.
You can also save the results that are shown as comments to the source file. Right-click within the Editor and select Save Results to Source File from the context menu. AQTime will append the appropriate comments before each profiled routine in the source file.
| Note: | After saving results to the source file, the Editor will display two sets of profiling results for the routine: one of these sets will be the comments generated by the Editor and another one - the results saved to the source file. |
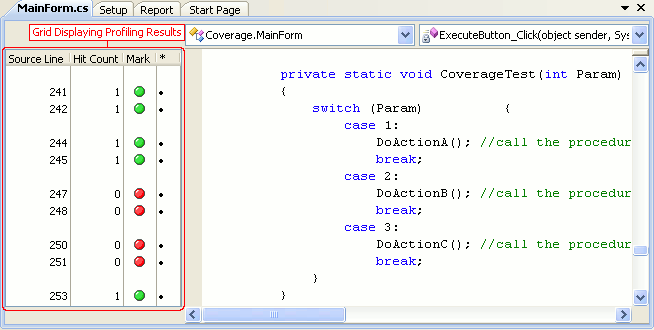
AQTime adds a grid to the Code Editor and displays profiling results in this grid.

The grid shows profiling results for routines that were profiled at line level. It contains the same set of columns as the Lines table of the Details panel plus one extra column: *. This column contains bullets for lines that were profiled.
If a routine was profiled at routine level, the grid columns will be empty, except for the * column. You can click bullets in this column to view profiling results of your routines.
You can also hover the mouse pointer over the bullet until the hint is shown. If a routine is profiled at line level, the hint displays the profiling result for the line. If a routine is profiled at routine level, the hint shows the routine results.
To hide the grid, select Hide from its context menu. The grid will become visible automatically when you double-click a routine in one of AQTime panels (Report, Details, Call Graph and so on).
If you split the Code Editor, the grid will be displayed in both parts of the Code Editor’s window.
 |
You can collapse and expand blocks of code in the Code Editor. However, the grid is not updated when you collapse or expand blocks. This happens because Visual Studio does not notify AQTime about collapsing and expanding. So, to ensure that the grid shows appropriate profiling results for routine and source lines, expand all the blocks. You can do this using the Outlining > Toggle All Outlining or Outlining > Stop Outlining item of the Code Editor’s context menu. |
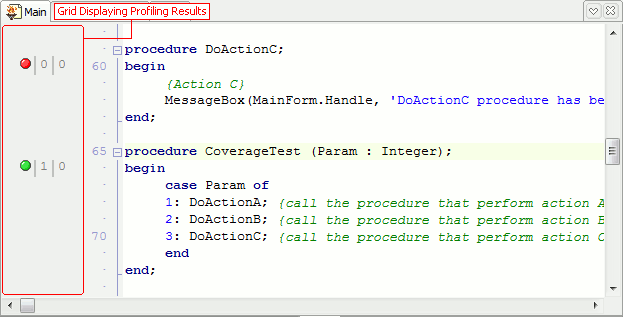
AQTime adds a grid to the RAD Studio Editor and displays profiling results in this grid.

If a routine is profiled at line level, the grid contains the same set of columns as the Lines table of the Details panel. If a routine is profiled at routine level, the grid contains the same set of columns as the Report panel.
If you place the mouse pointer over the grid, you will see the profiling results of the selected routine (routine line) as a hint. If the routine was profiled at line level, the hint will display the line profiling results. If the routine was profiled at line level, the hint that is called on any line of the routine will display the routine profiling results.
The grid can also display an indicator that shows which routine or source code line is problematic. The indicator is a rectangle whose saturation of red depends on the alert level: white means the routine or line is healthy, pink means you should pay attention to it, deep red means that this routine or line causes a performance problem.
 |
You can collapse and expand blocks of code in the Editor. However, the grid is not updated when you collapse or expand blocks. This happens because Embarcadero RAD Studio does not notify AQTime about collapsing and expanding. So, to ensure that the grid shows appropriate profiling results for routine and source lines, expand all the blocks. You can do this using the Unfold > All item of the Editor's context menu. |
Syntax Highlighting
The Editor panel uses syntax color highlighting - different fonts and colors for different code elements. This makes it easier to distinguish and locate these elements. For highlighting, AQTime uses syntax highlighting settings of the development tool associated with the file being displayed. Note that syntax highlighting settings set both font appearance and font language. For more information, see the Highlighting settings description.
See Also
Editor Panel
Editor Panel Settings
Working with the Editor Panel

 Viewing Profiling Results