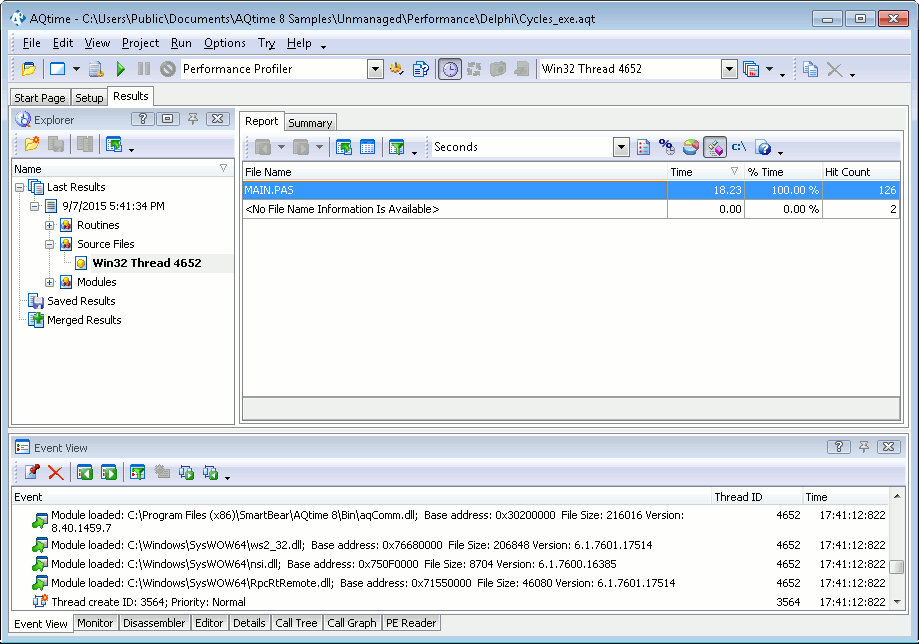
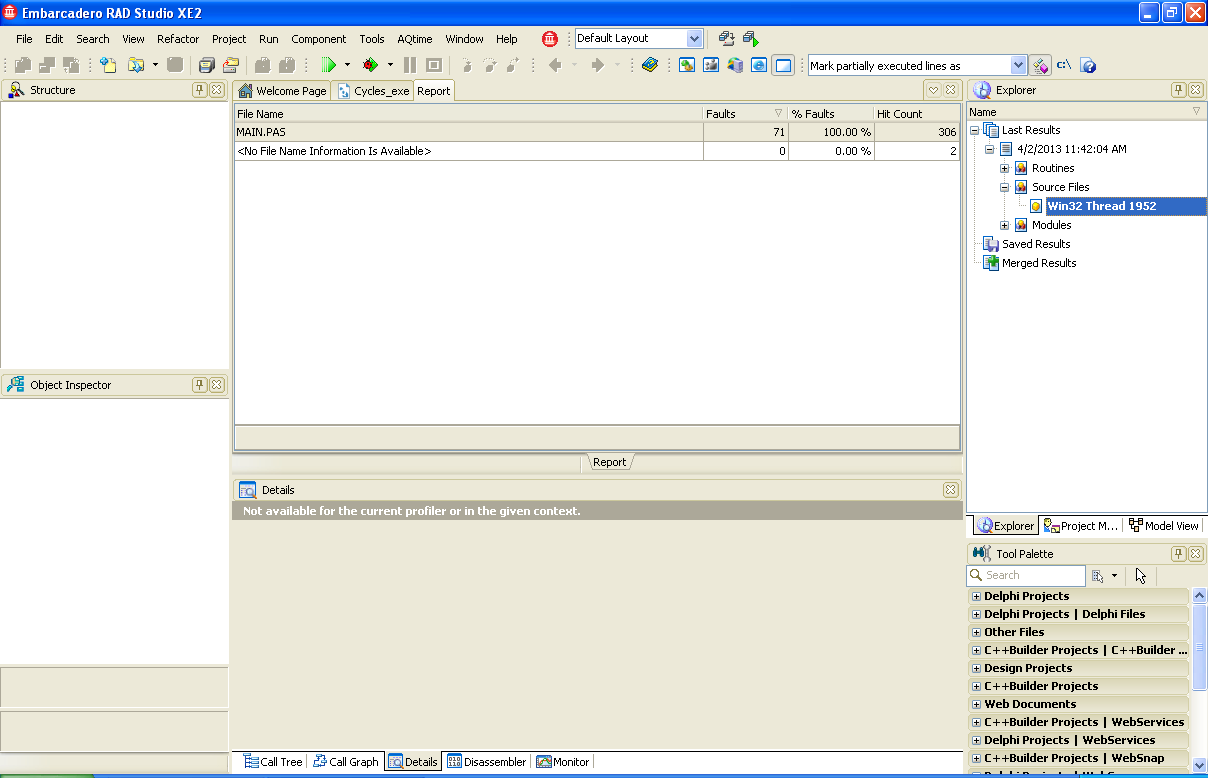
The Performance profiler results are divided into three categories: Routines, Modules and Source Files. When the Source Files category is selected in the Explorer panel, each row in the Report panel corresponds to a single source file of your application.
Below is sample output of Performance profiler results displayed in the Source Files category:
Every row in the Report panel holds results for an individual source file:
- Source file names are specified in the File Name column.
- The Hit Count and Skip Count columns show the number of routine calls that were profiled and excluded from profiling respectively.
- There are also several columns that depend on the active counter (like Time or Misses). For information on what columns are available, see the description of the Report panel.
For a detailed description of available columns, see the Performance Profiler Panels Reference.
See Also
Performance Profiler - Overview
Analyzing Profiler Results
Calculating Percent in the Report Panel
Profiling .NET Applications - Specifics


