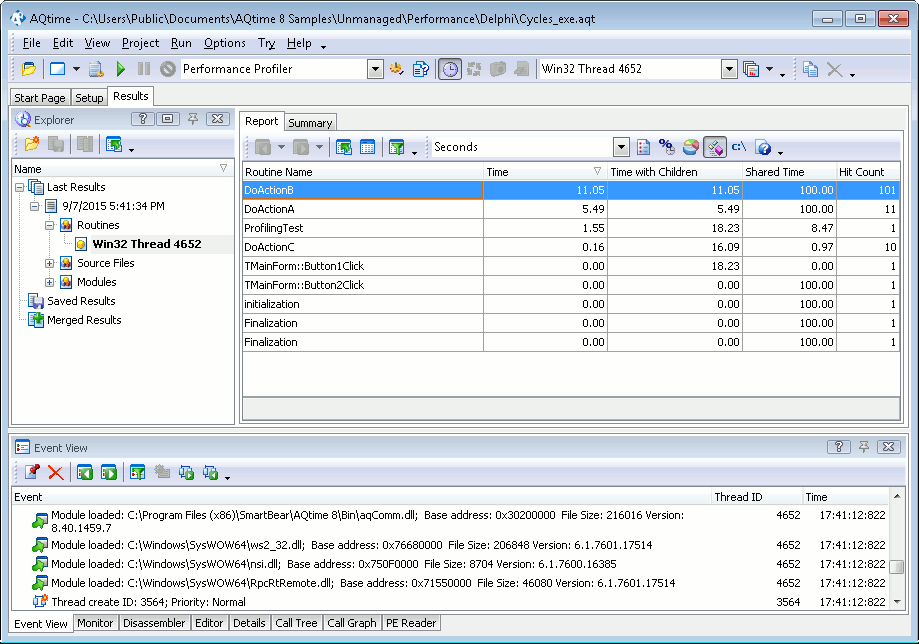
The Performance profiler results are divided into three categories: Routines, Modules and Source Files. When the Routines category is selected in the Explorer panel, each row in the Report panel corresponds to a single routine of your application. Selecting a routine in the Report panel updates the contents of the Details, Editor and Call Tree panels - they will display information concerning that routine.
Below is a sample output of Performance profiler results displayed in the Routines category:
The following sections describe what information you can get from profiling results.
Viewing Profiling Results for Routines
The Report panel displays profiling results for all routines in your application. The footer of the Report panel column holds summary values for data displayed in that column. For instance, the footer of the Hit Count column displays the total number of calls of all profiled methods. If you select two or more routines in the Report panel, the footer will show the summary values for the selected routine only (for more information on how to select several rows in a panel, see Selecting Several Records in a Panel).
To find the slowest routines, sort results by the Time (Time with Children) or % Time (% with Children) column. There are two predefined result views for the Performance profiler: More than 3% (body only) and More than 3% (with children). They filter results to display only those routines that take the most time to execute their own code (for example, % Time is greater than 3) or their own code along with the code of all other routines they call (% with Children is greater than 3). To hide the Time and Time with Children columns and to display the columns % Time and % with Children instead, use another predefined result view of the Performance profiler: Default with '%' fields. (This view touches not only Time columns, but also other similar columns, for example, Faults and % Faults, Branches and % Branches, etc.)
You can select any of these result views from the Result Views drop-down list on the Standard toolbar or from the View > Result Views menufrom the Result Views dialog. To display it, choose AQTime > Views from Visual Studio’s menufrom the Result Views dialog. To display it, click the  Result Views button. Note that this button does not reside on any toolbar by default. However, you can add the button to any RAD Studio’s toolbar via the Toolbar Customization dialog. In this dialog, switch to the Commands page, select the View.AQTime category in the Categories list, drag the Result Views command from the Commands list and drop it on the needed toolbar. For more information, see Result Views.
Make sure that you compare the columns in the Report panel. Most of the methods within the profiled application call other ones. A fast method can call a slow one, making the caller appear slow too. If there is a big difference between Time and Time with Children columns (or % Time and % with Children columns), then the child methods slow down the method analyzed on that line.
The usefulness of the % with Children column is that it tells you which calls are the expensive calls. A function may cost time due to its own code, due to the child calls it makes, or due to the time spent on the JIT compiling or on the garbage collecting - but in any case it costs time. Often, an optimization will consist simply of making more efficient child calls - for instance, in moving a child call out of a loop. % Time reports the cost of the function’s own code. % Time with Children reports the actual cost of running the function, no matter if the cost is incurred in the function's code or in the calls it makes.
| Note: | The  % with children relative to real values option does not change the relationship between the values in this column; the longest remains the longest and what is half as long remains half as long. If the option is enabled, the figures are all simply made larger (and the column total is above 100%). With % with children relative to real time enabled, 25% means that calls to the current function (and child calls) consumed a quarter of the entire profiled time. With the option disabled, the 25% would be much smaller, say 7.9%, and it would mean that calls to the current function (and child calls) consumed nearly 8% of the total time spent on any call during profiling, child calls being counted once for themselves, and again for their caller, and again for their caller’s caller, etc. The column total would be 100%. See Calculating Percent in the Report Panel for more information. % with children relative to real values option does not change the relationship between the values in this column; the longest remains the longest and what is half as long remains half as long. If the option is enabled, the figures are all simply made larger (and the column total is above 100%). With % with children relative to real time enabled, 25% means that calls to the current function (and child calls) consumed a quarter of the entire profiled time. With the option disabled, the 25% would be much smaller, say 7.9%, and it would mean that calls to the current function (and child calls) consumed nearly 8% of the total time spent on any call during profiling, child calls being counted once for themselves, and again for their caller, and again for their caller’s caller, etc. The column total would be 100%. See Calculating Percent in the Report Panel for more information. |
Viewing Profiling Results for Individual Code Lines
If you want to collect profiling results for code lines, the following requirements should be met:
- The application should be compiled with debug info (this concerns both unmanaged, .NET and Java modules). For more information, see How AQTime Profilers Use Metadata and Debug Information.
- The profiled routine should be added to a line-level profiling area. For more information, see About Profiling Levels.
If both conditions are met, you can view profiling results for individual source lines in the Details and Editor panel. Note, however, that profiling a large amount of code at line level can slow down the profiling process.
Editor Panel
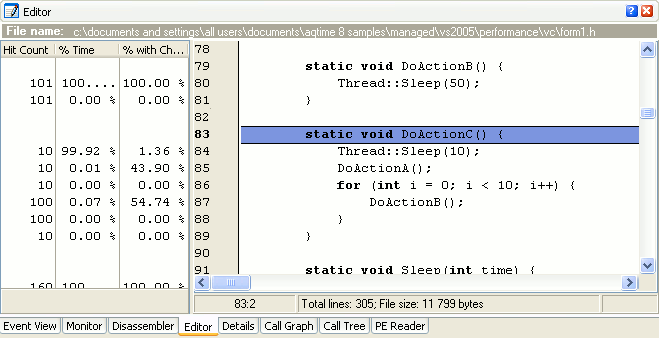
If the source file of a routine is specified in the Project Search Directories, the Editor panel will show the source code for the routine you clicked.
The Editor gutter displays various profiling results (Time, Hit Count, etc.) next to each source code line. To select which columns to display in the gutter, use the Field Chooser window. To bring it up, select Field Chooser from the context menu. See Adding and Removing Columns. The line profiling results are available, of course, only if the routine was profiled at line level:
 |
The Code Editor of Visual Studio lets you collapse and expand blocks of source code. The grid, which AQTime adds to the Code Editor to display profiling results, supports neither collapsing, nor expanding, because Visual Studio does not send appropriate notifications to AQTime. So, to ensure that the grid shows proper profiling results for source lines and routines, please expand all the collapsed blocks of code. To do this, use the Outlining > Toggle All Outlining or Outlining > Stop Outlining item of the Code Editor’s context menu. |
 |
The Editor of Embarcadero RAD Studio lets you collapse and expand blocks of source code. The grid, which AQTime adds to the Editor to display profiling results, supports neither collapsing, nor expanding, because Embarcadero RAD Studio does not send appropriate notifications to AQTime. So, to ensure that the grid shows proper profiling results for source lines and routines, please expand all the collapsed blocks of code. To do this, use the Unfold > All item of the Editor’s context menu. |
Details Panel - Lines Pane
The line profiling results are displayed on the Lines page of the Details panel. To view them, select the desired routine in the Report panel and then switch to Details:
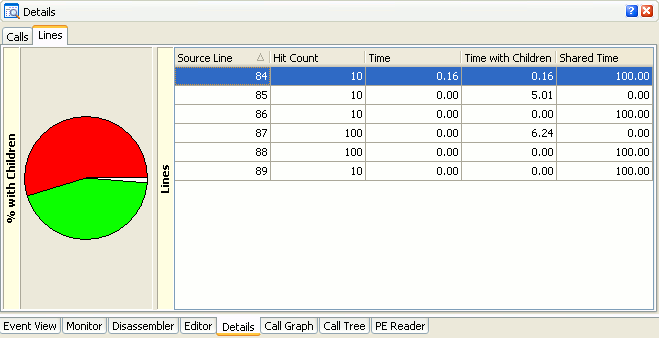
The Lines page is very similar to the Report panel. You can sort the profiling results, for example, by the Time column to find the lines that take much time, double-click the desired line and inspect it in the Editor panel.
Viewing the Hierarchy of Function Calls
You can view the hierarchy of function calls for the routine that is currently selected in the Report panel in one of the panels described below. They represent the same information in a different way.
Details Panel - Calls Pane
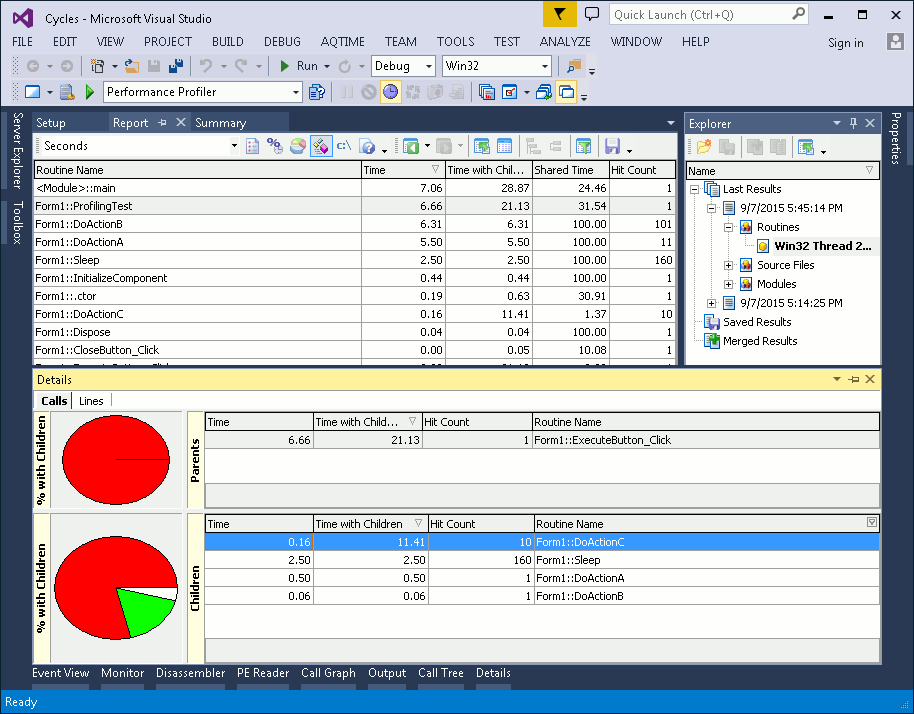
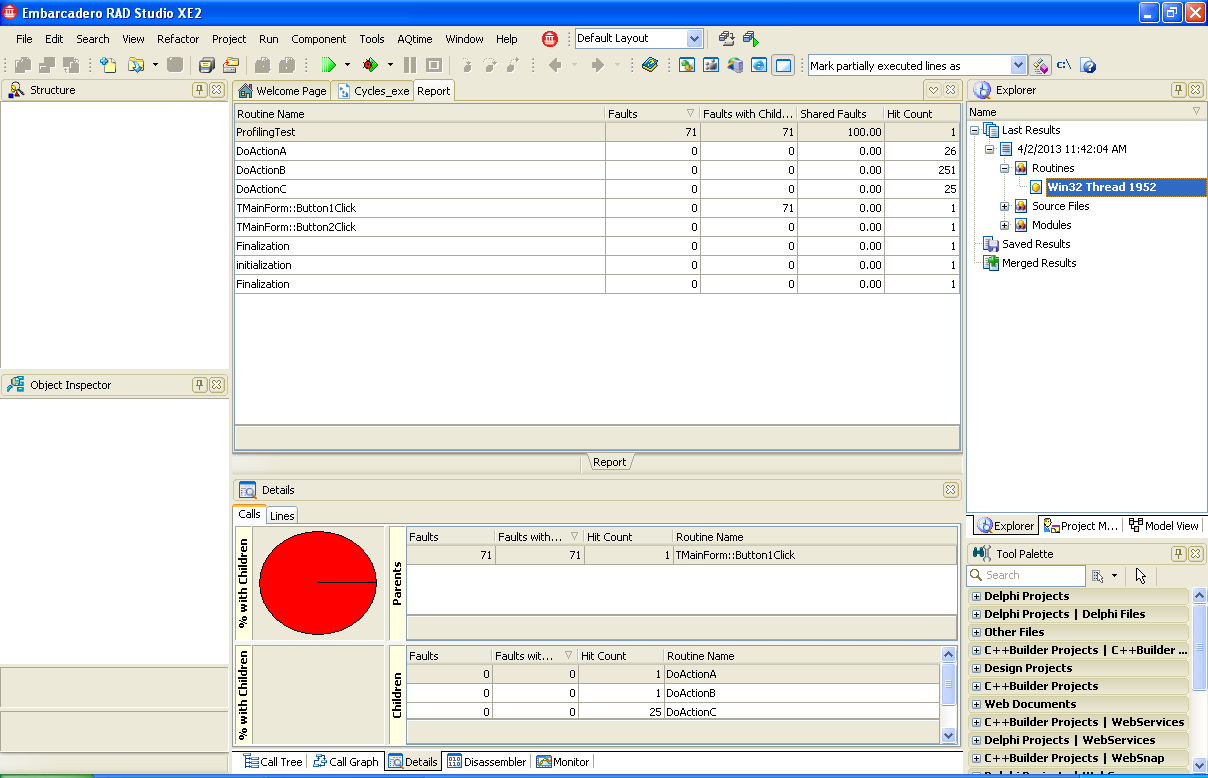
The Calls pane of the Details panel acts as a “magnifier” for parent-child call relationships related to one row in the Report panel. Here is a sample view of profiling results in this tab:
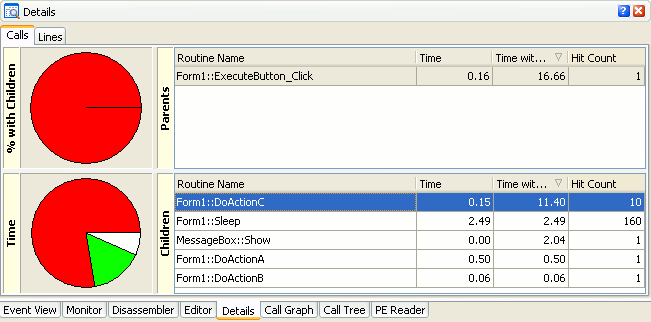
Some results in the Parents and Children tables belong to the routine currently selected in the Report panel. For instance, the Time column in Parents displays the time spent by the selected routine in its parent routine; the Time column in Children displays the time spent by a child routine in the selected routine. For more information on results displayed in the Details panel as well as for the column description, see Performance Profiler - Details Panel.
Double-clicking on a row in the Details panel will open the Editor and position the cursor on the routine that was clicked. The double-click will also update the other panels to the routine displayed on that row. Switching from panel to panel in this way, when trying to get the desired information out of the Performance profiler results, is made much easier by the “browser” buttons,  Display Previous and
  Display Next, on the Report toolbar.
Call Tree Panel
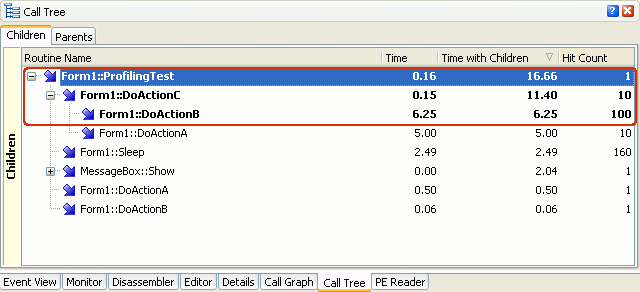
The Call Tree panel also displays the hierarchy of function calls. It contains two tables: Parents and Children. The Parents table holds all function calls that lead to the call to the currently selected routine. The Children table displays the hierarchy of old child calls that were initiated from the selected routine.
The critical path for the routine is displayed in bold (critical path is the “longest” path for the routine in the hierarchy of function calls, for instance, the one that took the longest to execute).
 |
In some cases, the Call Graph and Call Tree panel may display fake call routes. Also, according to its settings, the Call Graph panel may display empty results for some routines. For detailed information on these problems, see Tracing Call References - Specifics. |
Call Graph Panel
The Call Graph displays the function calls hierarchy (parent - child), centering on the clicked method. You can travel up and down the call tree in the panel by clicking the routines’ rectangles.
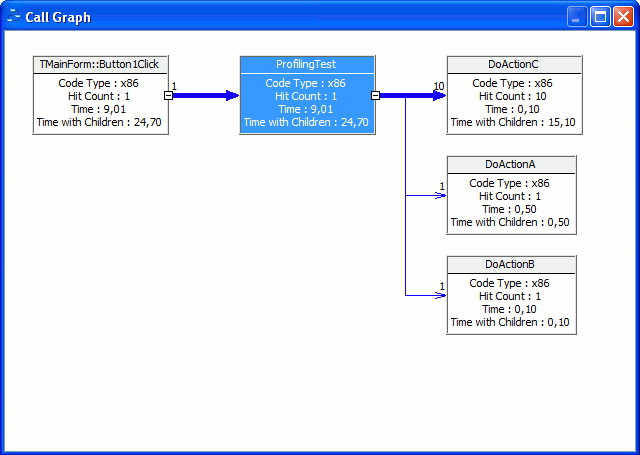
The bold arrows indicate the critical path, that is, the “longest” path for the routine in the hierarchy of function calls, for instance, the one that took the longest to execute.
See Also
Performance Profiler - Overview
Search for Bottleneck Reasons
Analyzing Profiler Results
Calculating Percent in the Report Panel
Profiling .NET Applications - Specifics

 Viewing Profiling Results for Routines