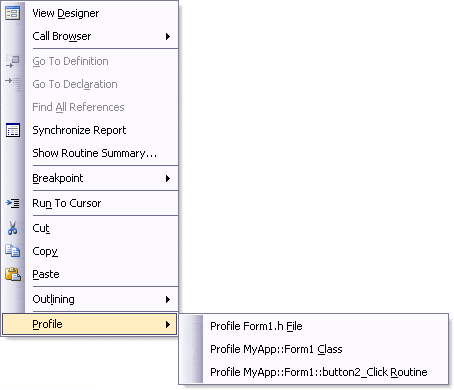
If AQTime is integrated into Microsoft Visual Studio, AQTime’s Editor panel is not available. You can view the source code of the profiled modules in the Code Editor, which is Visual Studio’s native text and code editor. AQTime extends the functionality of the Code Editor to provide interaction with AQTime panels and to display the profiling results along with the source code.
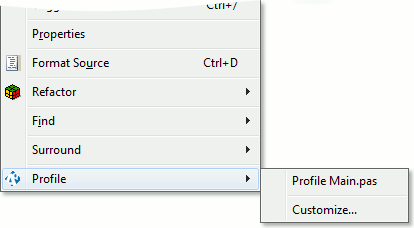
If AQTime is integrated into Embarcadero RAD Studio, AQTime’s Editor panel is not available. You can view the source code in Embarcadero RAD Studio’s native text and code editor. AQTime extends the functionality of RAD Studio’s editor to provide interaction with AQTime panels and to display profiling results along with the source code.
This topic provides information on common tasks you can perform in the EditorVisual Studio Code EditorRAD Studio Editor.
 Viewing the Source Code of Profiled Routines
 Profiling Routines, Classes and Source Files
 Profiling Routines, Classes and Source Files
 Collapsing and Expanding Comments
 Saving Profiling Results to the Source Code
Viewing the Source Code of Profiled Routines
To view the source code of the desired routine, double-click it in the Setup, Summary, Report, Details, Call Graph, Call Tree, PE Reader or Event View panel.
The Editor panelCode EditorRAD Studio Editor automatically updates its content to display the source code of the clicked routine.
Viewing Profiling Results
If you want to view profiling results for the routine whose source code is currently displayed in the Editor panelCode EditorEditor, do the following:
-
Right-click somewhere in the routine’s code and select Synchronize Report from the context menu.
-- or --
-
Click a bullet in the * column of the grid displayed in the Code Editor.
-
AQTime shows the Routine Summary dialog displaying profiler results for a routine that contains the code line which bullet you have clicked.
-- or --
-
Right-click somewhere within the source code of the desired routine and choose Show Routine Summary from the context menu.
-
This will also open the Routine Summary dialog displaying the profiling results.
-- or --
-
Hold the mouse pointer over the bullet until the hint is shown.
-
If the routine was profiled at line level, the hint displays the profiling results for the line. If the routine was profiled at routine level, the hint displays the routine results.
-- or --
-
Right-click somewhere within the routine’s code and select Goto <Routine_Name> from the Profile submenu of the context menu.
Profiling Routines, Classes and Source Files
To profile the routine, class or object whose source code is currently displayed in the Code Editor, choose the appropriate item from the Profile submenu of the Code Editor's context menu.

AQTime will add the corresponding routine, class or the source file to an including area in your AQTime project and start profiling.
Profiling Routines, Classes and Source Files
To profile the routine, class or object whose source code is currently displayed in the Editor, choose the appropriate item from the Profile submenu of the Editor's context menu.

AQTime will add the corresponding routine, class or the source file to an including area in your AQTime project and start profiling.
Arranging Grid Columns
If the application was profiled at line level, the Editor panel contains a grid that displays the results of line profiling (see Editor Panel Contents).If the application was profiled at line level, the Code Editor contains a grid that displays the results of line profiling. See Editor Panel Contents.AQTime adds a grid to RAD Studio’s Editor and displays the profiling results in that grid (see Editor Panel Contents). You can move the columns within this grid as well as add needed columns to the grid or hide them (see Arranging Columns, Lines and Panels).
You can also configure the format of grid columns. To do this, select Format Columns from the context menu and use the ensuing Format Columns dialog.
To configure which of the available columns to display in the grid and which of them to hide, right-click the routine’s source code and select AQTime > Customize from the context menu. This will call the Customize dialog, where you can choose the desired columns and uncheck the unwanted ones.
To save the grid layout to the Default result view, choose Save to Default View from the grid’s context menu. To restore the grid layout, choose Restore Default View from the grid’s context menu.
To save the grid layout to the Default result view, choose Save to Default View from the grid’s context menu. To restore the grid layout, choose Restore Default View from the grid’s context menu.
Collapsing and Expanding Comments
You can configure the Editor panel to display profiling results as comments in the source code (see Editor Panel Contents).
To collapse and expand the blocks of comments, click  and
and  in the Editor’s gutter.
To collapse and expand all the blocks of comments, use the  Collapse All and
  Expand All commands of the panel’s context menu.
Saving Profiling Results to the Source Code
You can configure the Editor panel to display profiling results as comments in the source code (see Editor Panel Contents) and save profiling results shown as comments to the source file. To do this, right-click within the Editor and choose Save Results to Source File from the context menu. AQTime appends the appropriate comments before each profiled routine in the source file.
| Note: | After saving results to the source file, the Editor will display two sets of profiling results for the routine: one of these sets will be the comments generated by the Editor and another one - the results saved to the source file. |
Refreshing the Panel Contents
When the file that is currently open in the Editor panel is changed by another program, you may need to refresh the panel contents. To do this, right-click anywhere within the panel and select Refresh from the context menu.
Searching the Editor PanelCode EditorRAD Studio Editor
To search for text in the file that is currently displayed in the Editor, select Find or Find Next from the Edit menu. For information on search options, see the description of the Find dialog.
To search for or replace text in the Code Editor, use the standard Visual Studio methods.
To search for or replace text in the Editor, use the standard Embarcadero RAD Studio methods.
Printing the Editor Panel Contents
To print the file that is displayed in the Editor panel, select File > Print from AQTime’s main menu.
To view the file in the Print Preview form before sending it to the printer, choose File > Print Preview. Using this form, you can select the paper size, specify margins, background and so on. See Print Preview Form for more information.
The profiling results for routines are printed as comments before the routine’s code. The profiling results for lines (those that are displayed in the grid) are also transformed into comments that are placed before each line of code.
See Also
Editor Panel
About the Editor Panel
Editor Panel Contents
Routine Summary Dialog
Customize Dialog
