AQTime profilers use areas to determine what portions of your code to profile and what routines to include in call stacks. This topic provides an overview of using areas in AQTime.
About Areas in AQTime
Areas or profiling areas are collections of elements — source files, routines, classes — that AQTime uses to determine what code parts should be included in or excluded from profiling. In other words, areas represent a “typical profiling interest” for your project.
Profilers that collect call stack information (for example, the Allocation profiler) also use areas to specify what routines should be included in or excluded from the collected call stacks. We call these areas stack areas to distinguish them from the areas that define code portions for profiling.
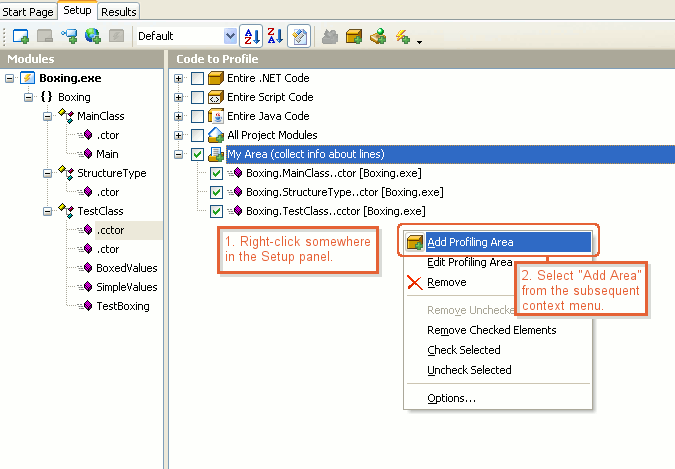
You create areas in AQTime’s Setup panel:
An element like a routine, class, source file or module can belong to one or several areas. If you add a class, unit, source file or module to an area, this means that all the functions of this class, source file or module belong to that area.
You can turn areas on and off by check or unchecking them in order to expand or narrow the code portion to be analyzed. If no area is selected, nothing will be profiled. For more information on specifying profiling bounds, see Checking Elements to Profile.
Including and Excluding Areas
AQTime supports including and excluding area types. Including areas specify elements to be analyzed during the profiler run. Excluding areas contain the elements you want to skip for some reason. Suppose, you want to include almost all methods from a class or namespace, but skip two routines. You can always add the needed elements to an including area one by one, but, for convenience, you also have the option of adding the entire class or namespace to an including area and then defining a special excluding area to prevent profiling of a few sub-elements you want to skip.
Stack areas can also be either including or excluding. The latter help you quickly exclude unwanted routines from the stack data collected by AQTime profilers.
Area Levels
Profiling Areas
The code specified in an including profiling area can be analyzed at three levels of detail: class, routine and line —
-
Profiling areas of the class level are supported by profilers that trace memory leaks. These areas specify what classes the profilers will trace. Class-level areas can hold classes and larger elements like files, units, namespaces and modules. If you add some larger element to a class-level area, this means that all the classes of this element are added to that area.
-
Routine level means that AQTime gathers information per routine: how many time it was called, how long it worked, and so on. Routine-level areas can include modules, units, namespaces, files, classes and individual routines.
-
Line level means profiling of source code lines within individual routines, classes, files or namespaces included in the area. Like routine-level areas, line-level areas can contain routines, classes and other larger elements like files, namespaces or modules.
AQTime profilers support either class-level or routine- and line-level areas. For detailed information, see the section Profilers That Support Areas below.
Excluding profiling areas can be of the class- or routine-level only. Line level is meaningless for them.
Stack Areas
AQTime supports stack areas of the routine and line levels. The difference between them is that for the routines in line-level stack areas, AQTime reports the source line number from which the routine was called. For the routines in routine-level stack areas, AQTime reports the source line number where the routine’s implementation begins.
Profilers That Support Areas
-
Class-level areas are supported by the Allocation and Reference Count profilers.
-
Routine-level areas are supported by the following profilers:
-
Line-level areas are supported by the Performance, Sampling and Coverage profilers.
-
Stack areas are supported by the following profilers:
Predefined Areas
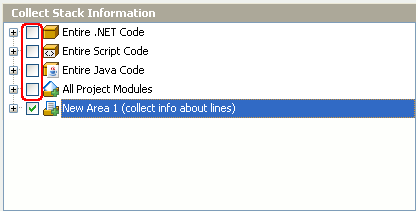
AQTime supports a number of predefined areas that help you quickly choose code for analysis:

These areas help you quickly include large portions of code in profiling tasks. They can also work as stack areas:
All Project Modules
If this area is selected, AQTime profiles the code of all the modules that are added to your current AQTime project. Use this area to get information on the entire application.
If this area is used as a stack area, AQTime includes all the routines, which are defined in modules of the current project, in the collected stack data.
-
Entire .NET Code
If this area is selected, AQTime profiles code of all the .NET assemblies that are used by the current project’s modules (including Silverlight modules). AQTime profiles even those assemblies that are not added to the Setup panel. You can use this predefined area, for example, to profile functions from .NET Framework libraries.
If this area is used as a stack area, AQTime includes all .NET functions that your application calls from any managed module in the collected stack.
Note: The Entire .NET Code check box overrides all the settings that exclude code from profiling (these settings are explained in Excluding Code From Profiling). -
Entire Script Code
If this area is selected, AQTime profiles all the routines executed by Microsoft Script Engine. Use this area to profile scripts launched by a web browser or another host application that uses this engine.
If this area is used as a stack area, AQTime includes all the script routines executed by Microsoft Script Engine in the collected stacks.
-
Entire Java Code
If this area is selected, AQTime profiles all the routines executed by the Java Virtual Machine. Use this area to quickly include all Java routines in profiling tasks: the routines that reside in modules of the current AQTime project and the modules of standard Java classes.
If this area is used as a stack area, AQTime includes all the functions executed by the Java Virtual Machine in the collected stack.
Note: If you tick the Entire Java Code check box, all the Java routines will be included in profiling, even those that are specified in excluding areas or that are excluded from profiling by other settings (these settings are explained in Excluding Code From Profiling).
Depending on the profiler, predefined areas can work at the class, routine or line level of detail. For instance, for the Coverage profiler you can select All Project Modules (Collect info about lines), and AQTime will profile all the routines in all the modules of the current project at line level.
| Profiling a large amount of code at line level (for example, when All Project Modules (Collect info about lines) is selected) can significantly slow down the profiling speed. You may not want to include all the application functions in profiling tasks, for instance, to make the profiler run faster. Therefore, we recommend that you first profile large applications at routine level (for instance, using All Project Modules (Routines only)). Once you find problematic classes and routines, you can add them to a custom line-level area. That is, using areas lets you narrow down the places of interest in the application. |
Auto-Converting of Areas
When profiling an application, you may need to use several profilers to collect detailed statistics on the application’s functioning. Typically, you start profiling an application with a full check of all application modules. After you find problematic classes or routines, you can include them in a line-level area and collect more detailed statistics for the in-depth analysis. Once you find the possible bottlenecks and create a custom area that includes the problematic code, you may need to collect more profiling information on this area with any other profiler.
To simplify profiling parts of code with multiple profilers, AQTime automatically converts profiling areas to stack areas and vise versa in your projects. Suppose, you have profiled your application with the Performance profiler and created a line-level profiling area called My Area. If you switch to the Allocation or Reference Count profiler that supports class-level areas only, AQTime will use your line-level My Area as a stack area, that is, it will use it to determine what information it should include in the call stack for the routines specified by this area. If you switch back to the Performance profiler, My Area will be converted back to a profiling area and will be used for specifying functions to be profiled.
Creating, Editing and Working With Areas
For detailed information on working with areas, see the following topics:
See Also
Using Areas
Creating, Editing and Deleting Areas
Adding Code to Areas
Checking Elements to Profile

 About Areas in AQTime