The Static Analysis profiler explores the debug information (for native applications) or metadata (for .NET Connected Applications) and collects information on routines and classes used in your application. It also gets the hierarchy of routine calls and class interlinks in your application as they are coded in the application’s source code.
This topic provides a brief overview of the profiler results and panels that contain them.
Viewing Summary Profiling Results
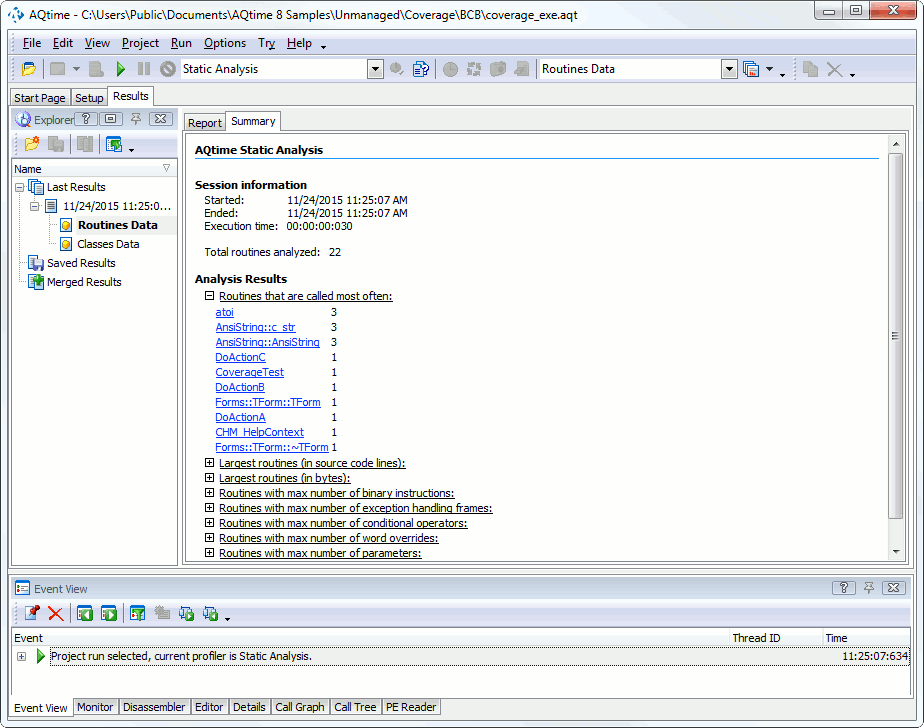
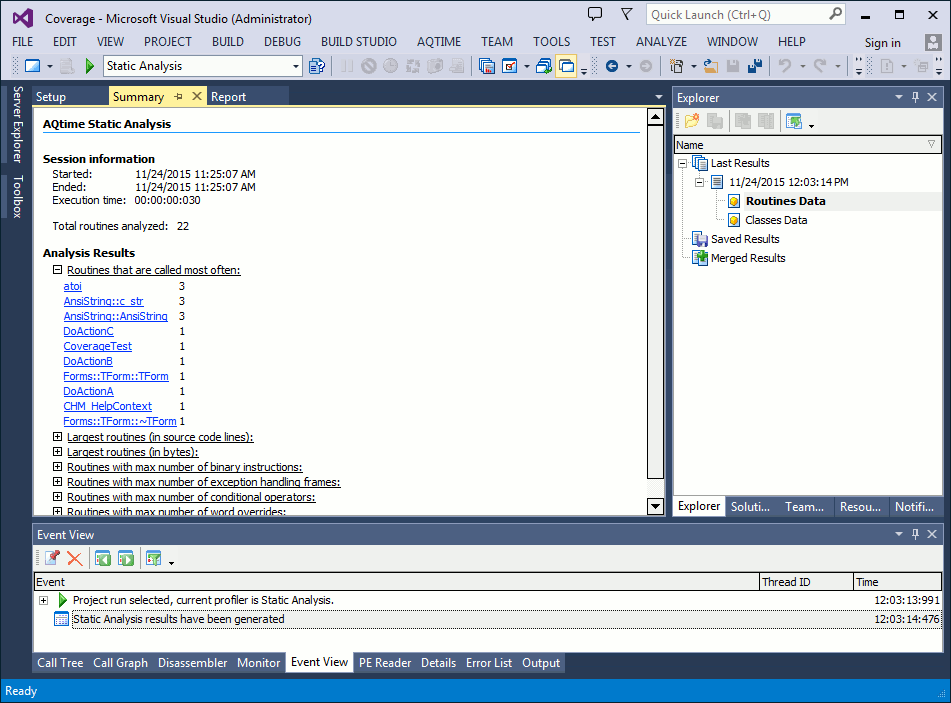
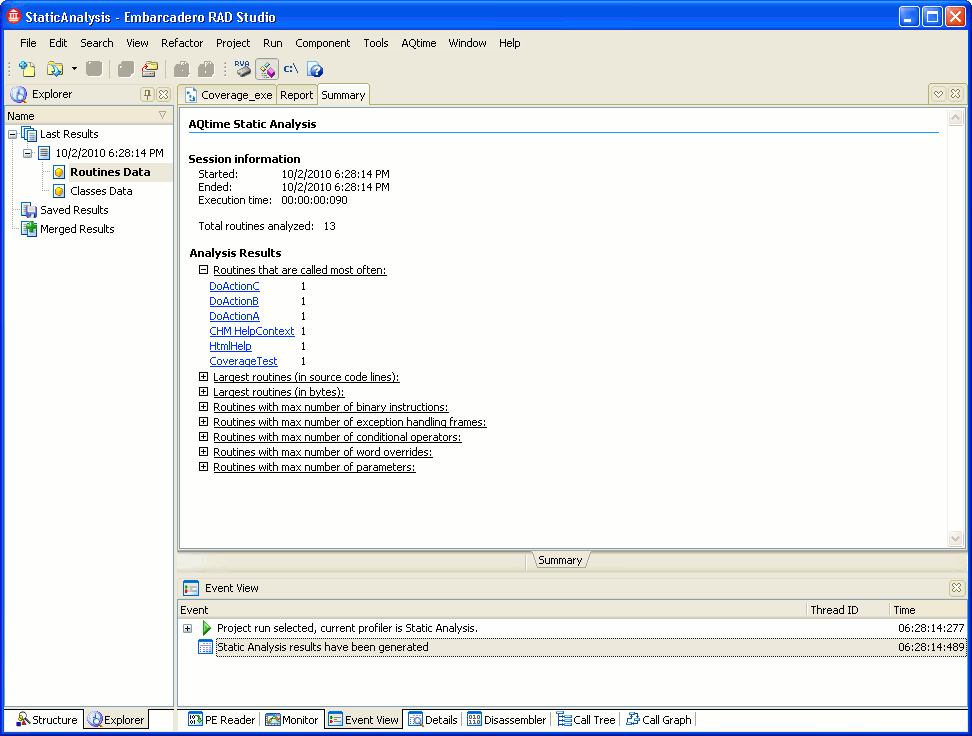
The Summary panel displays brief profiler results:
The summary provides information about the routines that are called most often, about the largest routines (in source code lines and in bytes), about routines with the maximum number of binary instructions and so on.
You can use the data displayed in the panel to quickly find routines that can potentially perform poorly.
Viewing Detailed Information
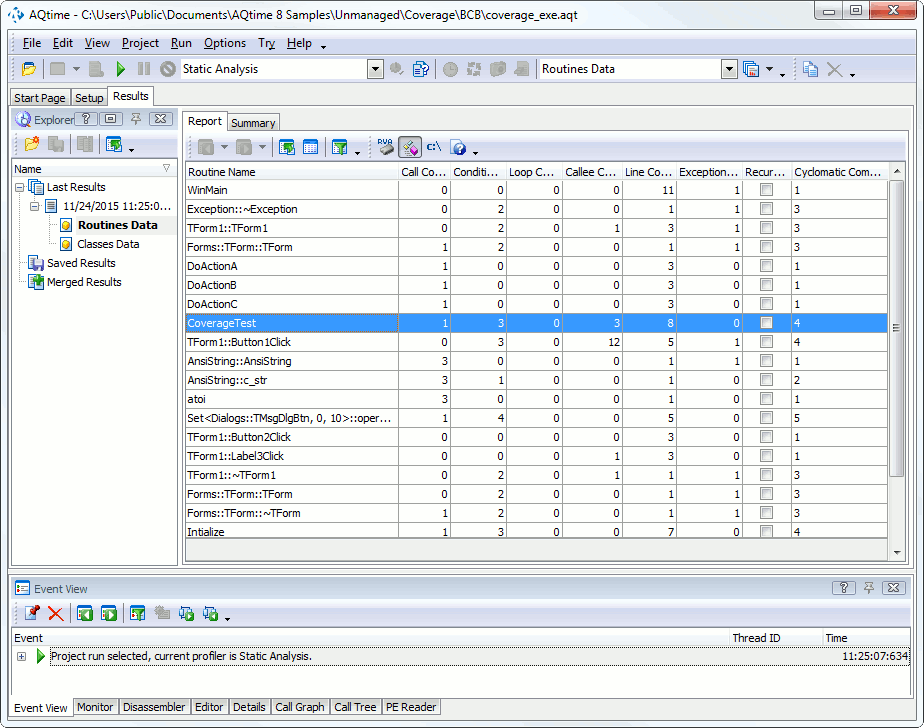
The Report panel is the “main” results display. It displays profiling results for routines and classes that exist in your application.
Below is a sample profiler output:
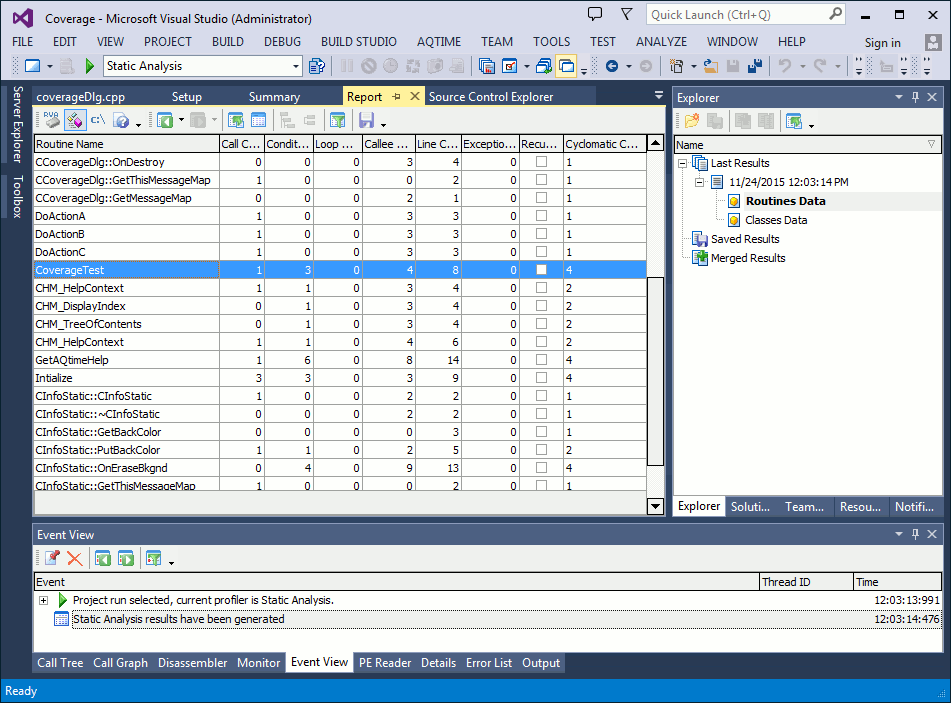
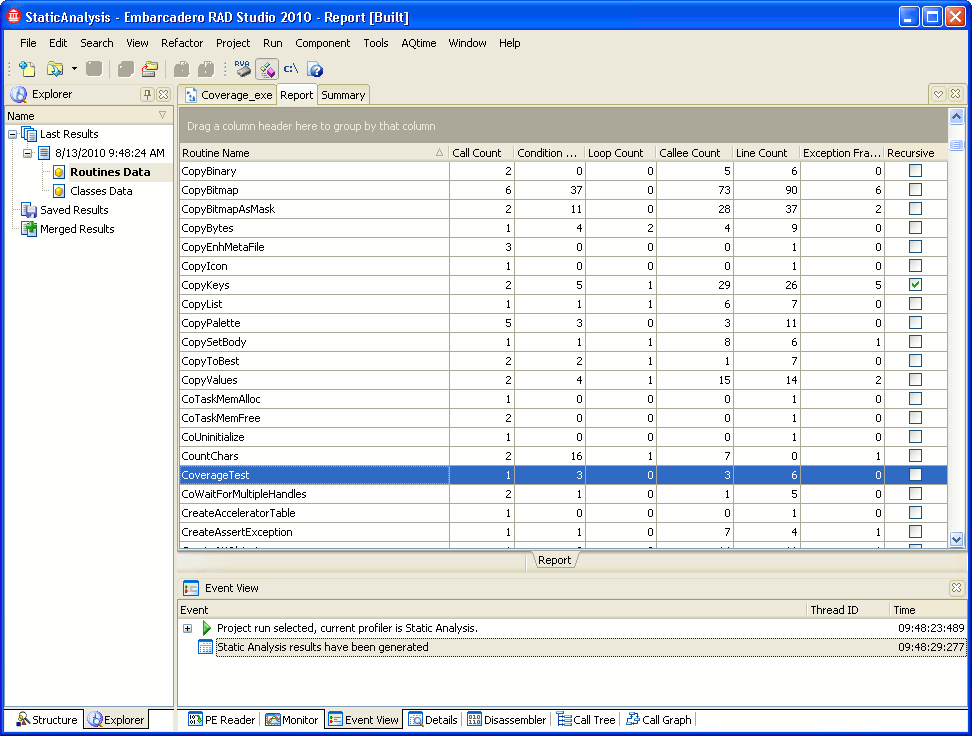
As you can see, the results are organized into two categories: Routines Data and Classes Data. The Routines Data category contains results for each single routine that exists in the application. The Classes Data category allows you to view summary profiling results for each class in your application.
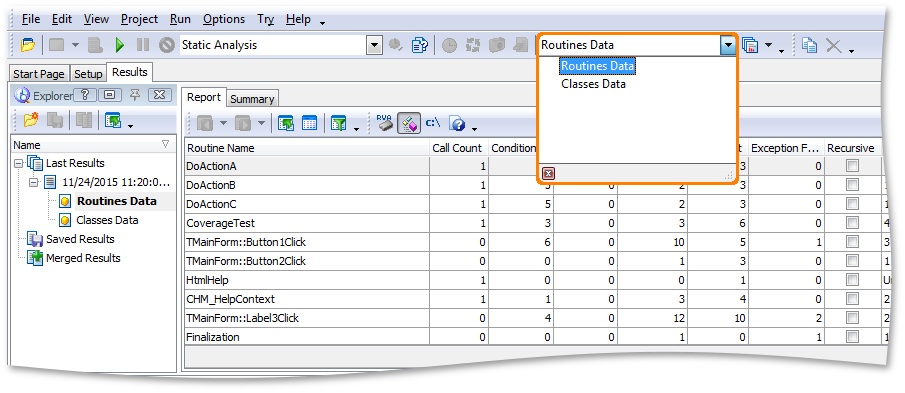
The categories are shown in the Explorer panel. You can also select the desired category from the Result Items box:
After you choose the desired category, AQTime updates the Report panel. The content of the Report panel depends on the currently selected category:
-
Routines Data
When this category is selected, the Report panel displays information on the routines that can potentially be called in the application. Each row shows profiling results for every single routine: the call count, address, size and so on. This gives you the entire picture of routine calls in your application. Other AQTime panels, such as Details, Call Graph or Call Tree, include additional results for the routine selected in the Report panel.
For a detailed description of the results that are displayed when the Routines Data category is selected, see Results of the Routines Data Category.
-
Classes Data
When this category is selected, the Report panel displays information about class interlinks (potential calls between class methods) in your application. Every row in the panel contains results for a single class: the number of methods in the class, the number of classes whose methods call the methods of the given class, the number of classes whose methods are called by the methods of the given class and so on.
Other panels, like Details, Call Graph or Call Tree, contain additional information on the class selected in the Report panel.
For a detailed description of the results that are displayed when the Classes Data category is selected, see Results of the Classes Data Category.
How to Filter Results
-
If the Routines Data category is selected, you can find routines that are called most often or have the greatest number of instructions. To do this, sort the results by the Call Count or Instruction Count column accordingly.
-
If the Classes Data category is selected, you can find classes that have the greatest number of methods and classes whose methods are called most often, and classes that call methods of other classes most often. To do this, sort the results by the Routine Count, Caller Class Count or Callee Class Count column accordingly.
-
You can quickly filter out routines (classes) that call or do not call other methods (methods of other classes). To do this, use the predefined result views Non-leaf routines (classes) or Leaf routines (classes) accordingly. Select the needed results view from the View > Results View menu or from the Results View list in the Standard toolbarfrom the Result Views dialogfrom the Result Views dialog.
-
If you want to separately view native code routines and classes, or .NET code routines and classes, simply select the appropriate predefined view: Native code routines and classes or .NET code routines and classes. You can select the needed view from the Results Views drop-down list on the Standard toolbar or from the View > Result Views menufrom the Result Views dialog. To display it, choose AQTime > Result Views from Visual Studio’s menufrom the Result Views dialog. To display it, click the
 Result Views button.
 -
You can group results by any column. When you group results by a column, besides “global” summaries shown in the footer of the panel, AQTime displays “local” summaries at the end of each group node. For more information on how to group, sort, filter and search for profiling results, see Analyzing Profiler Results.
By default, this item is hidden. To add it:
-
Right-click any AQTime toolbar and select Customize from the context menu.
-
In the Customize dialog, open the Commands tab and select the Standard category.
-
Drag the Result Items command to the desired toolbar and then close the dialog.
See Also
Static Analysis Profiler Results
Static Analysis Profiler
Static Analysis Profiler Results - Overview

 Viewing Summary Profiling Results