The results of the Static Analysis profiler are divided into two categories: Routines Data and Classes Data. When the Routines Data category is selected, the Report panel displays information on all the routines that can potentially be called in your application.
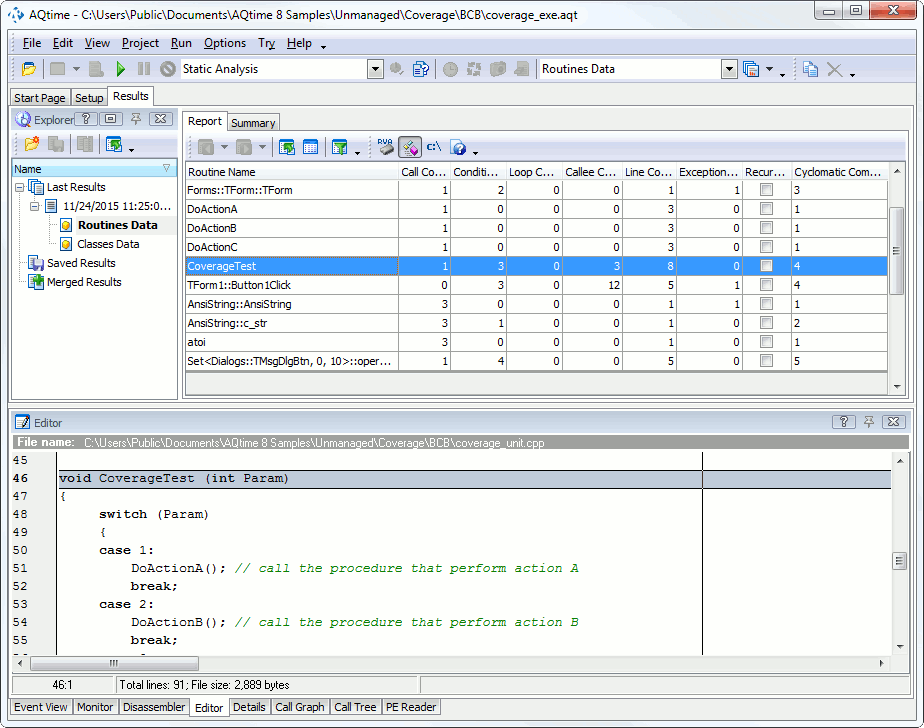
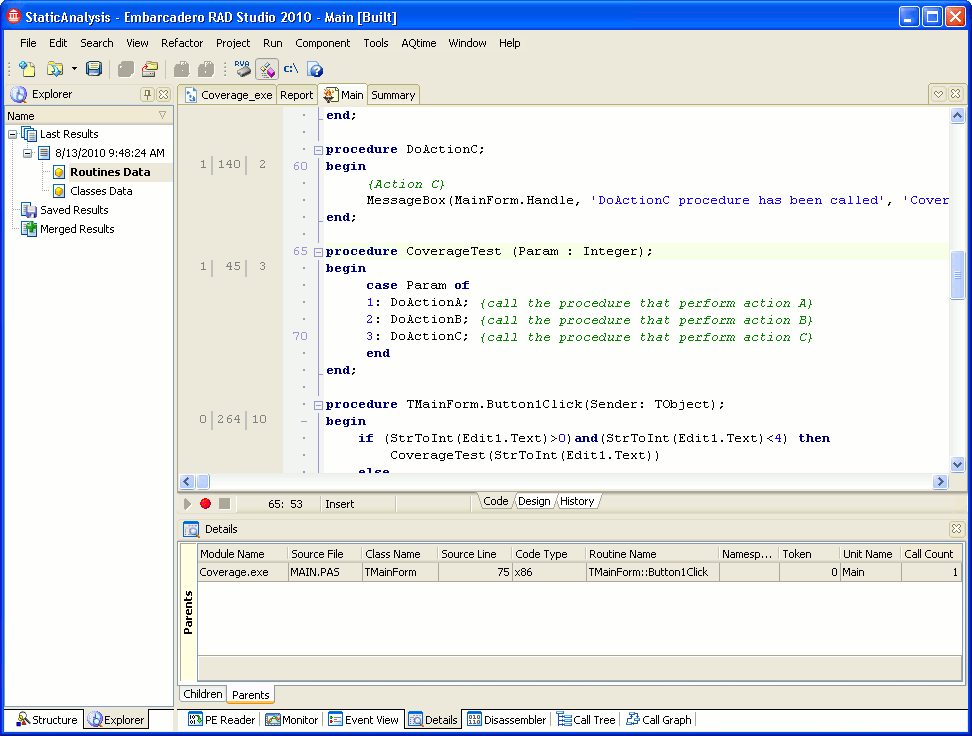
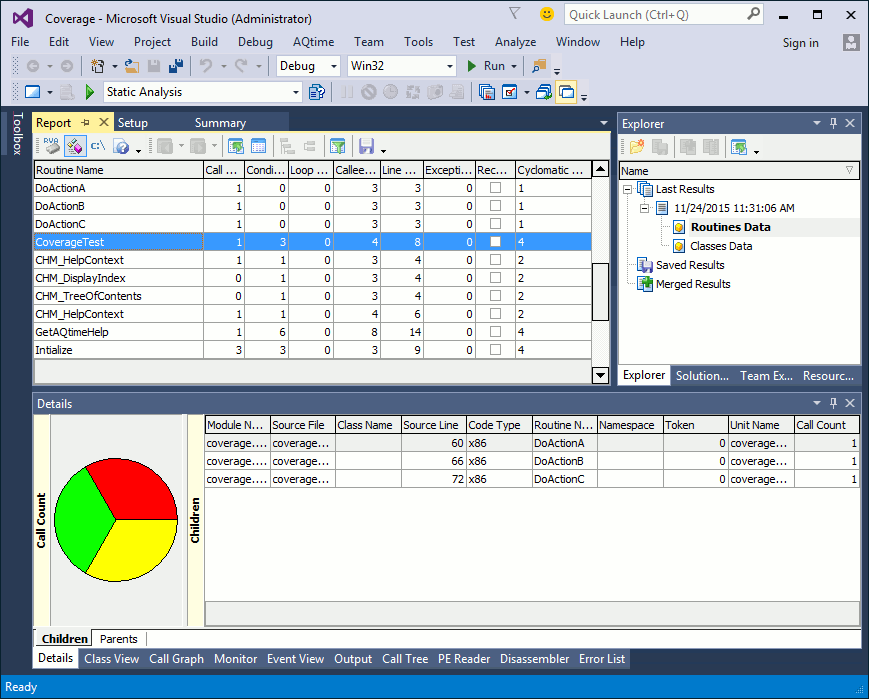
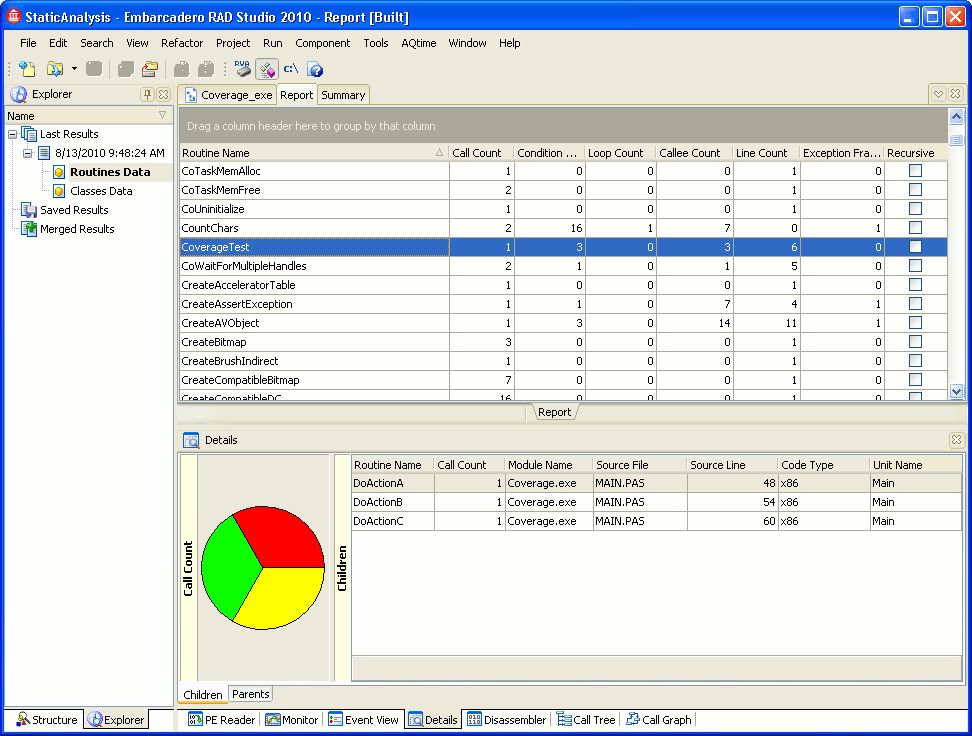
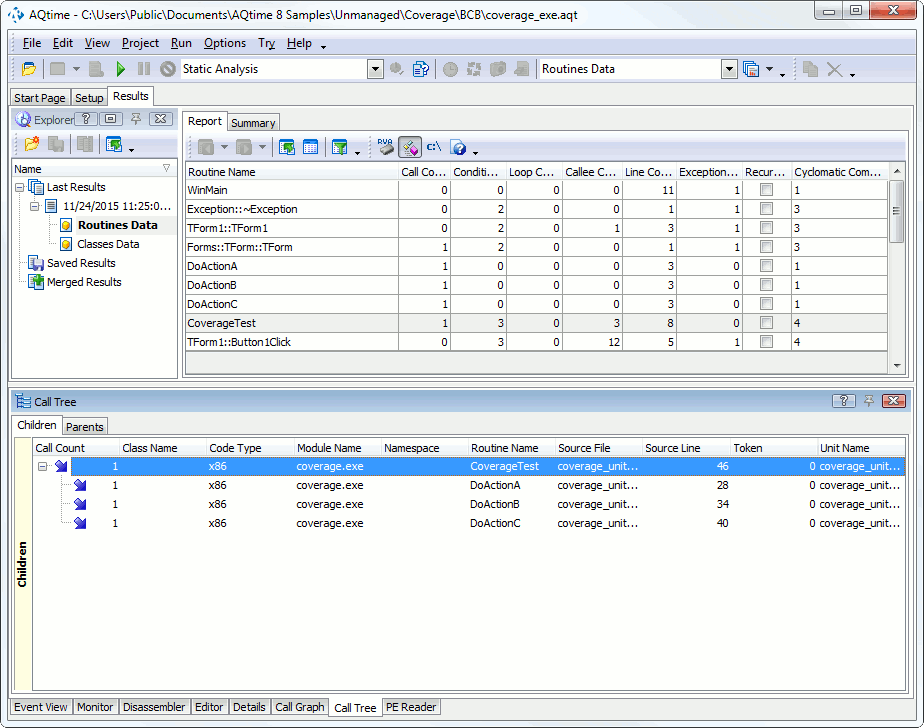
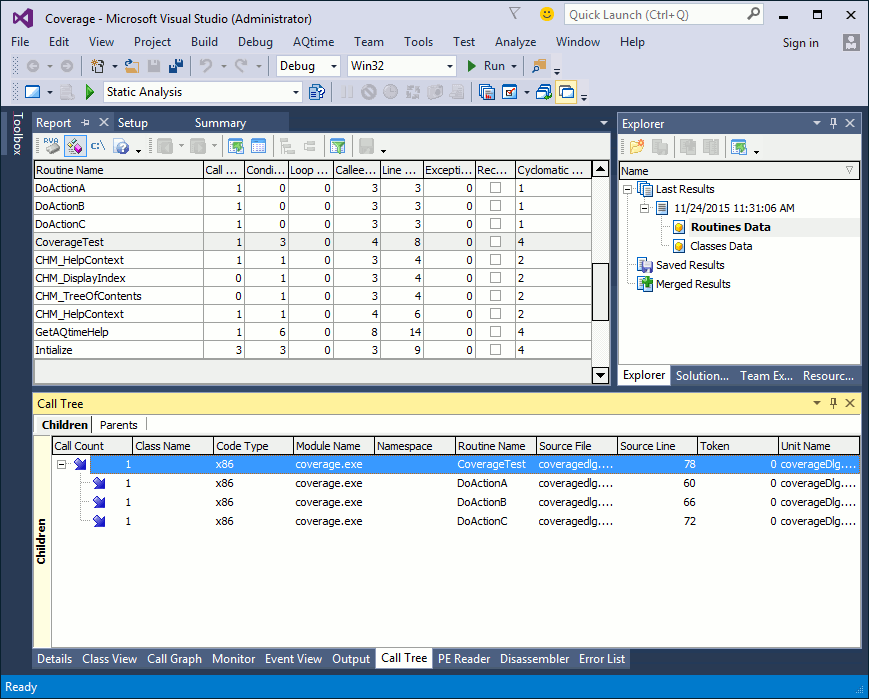
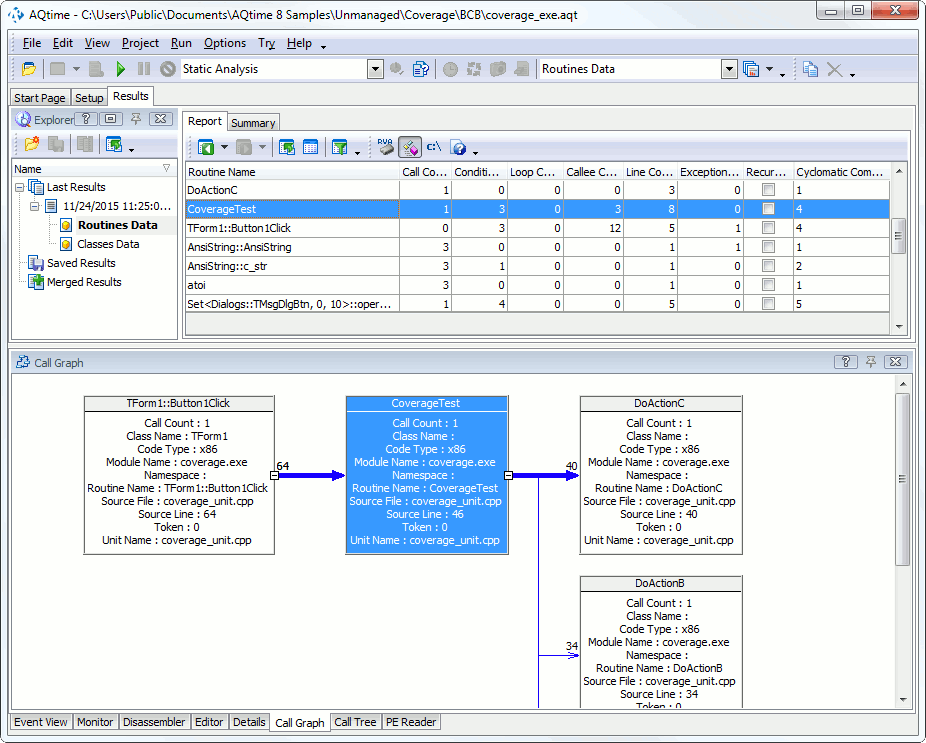
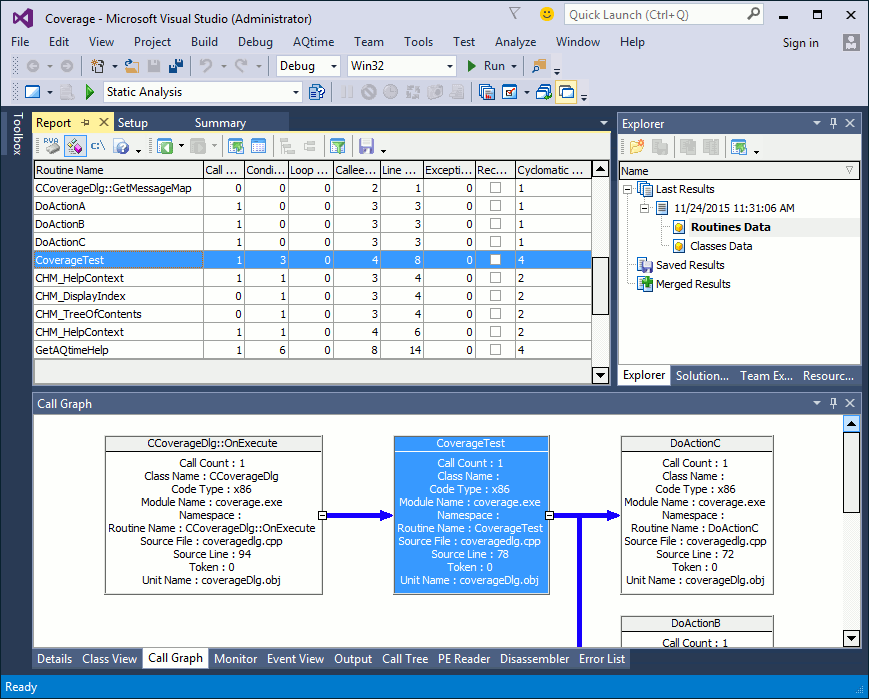
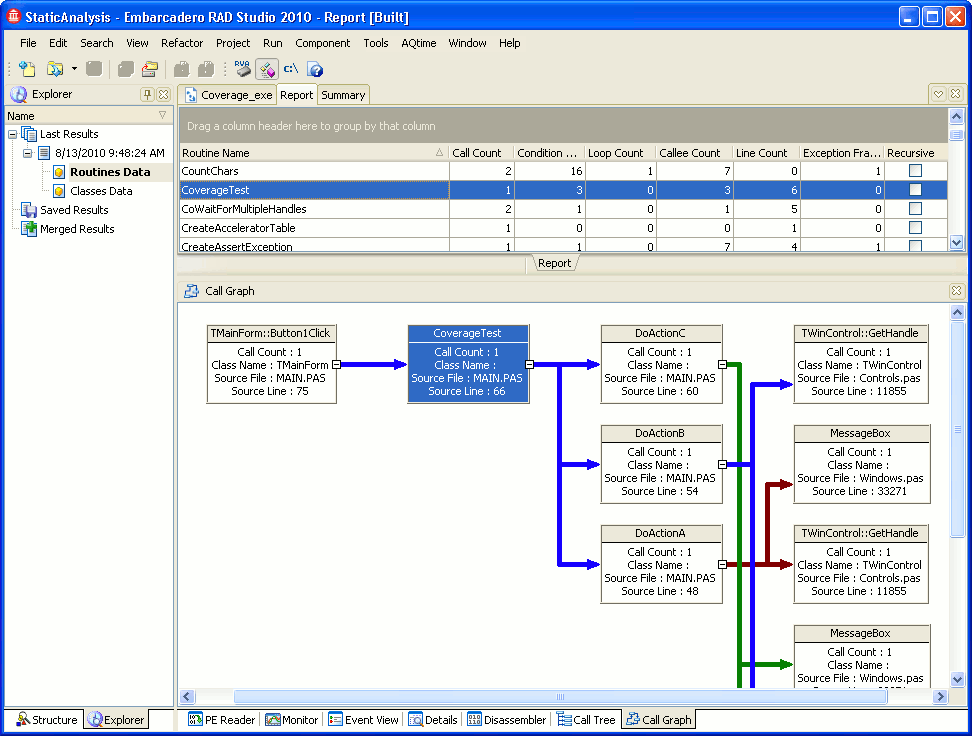
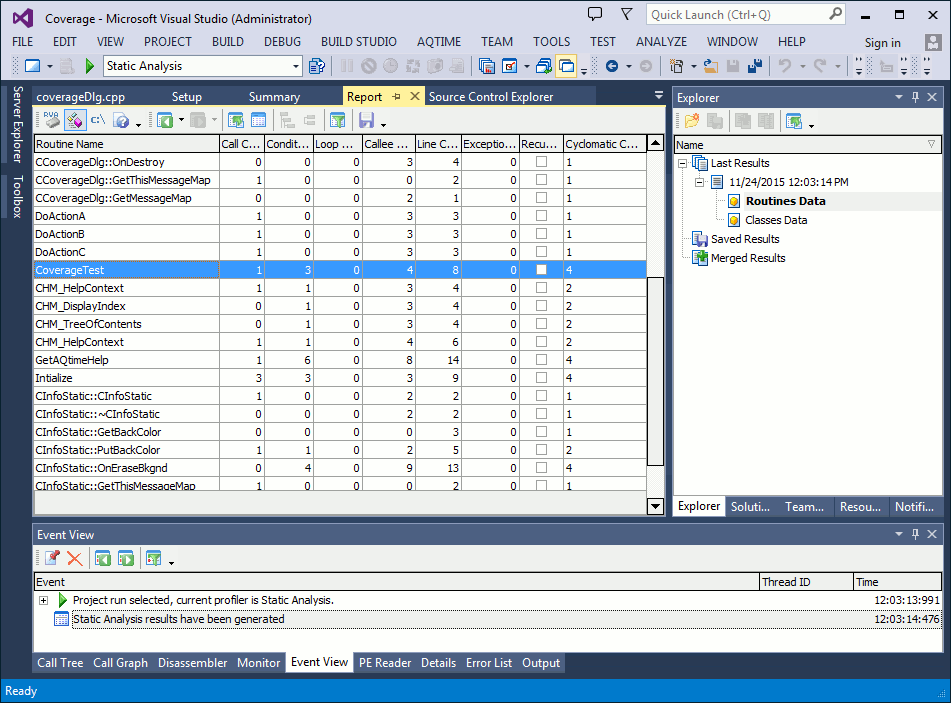
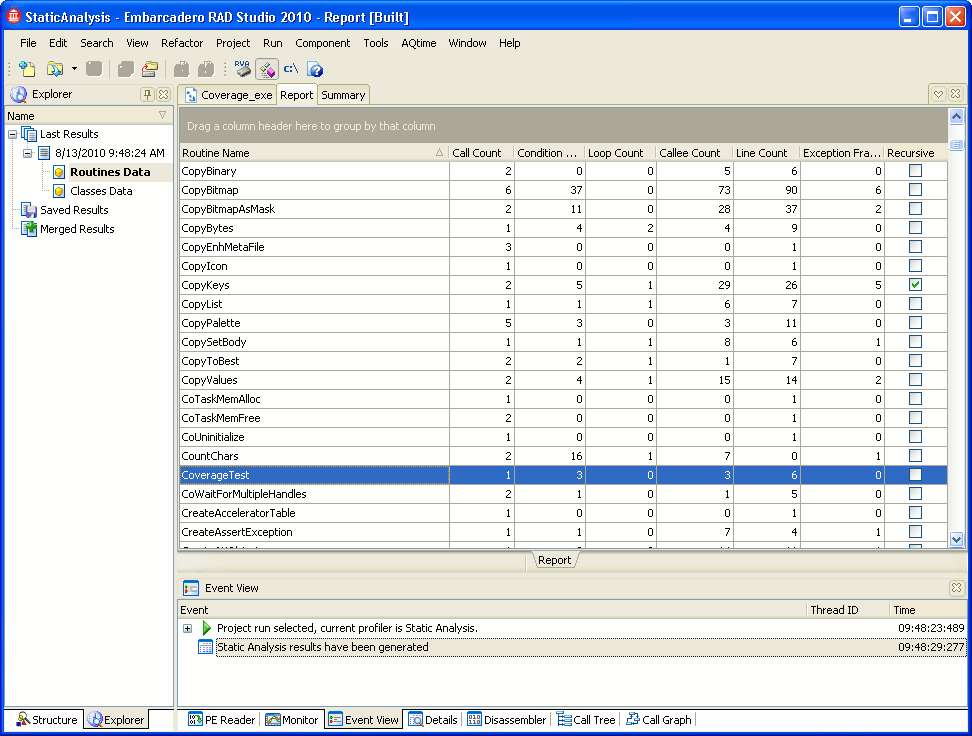
Below is a sample output of the Static Analysis profiler displayed in the Routines category:
This topic describes how to work with profiling results of the Routines category.
Viewing Profiling Results
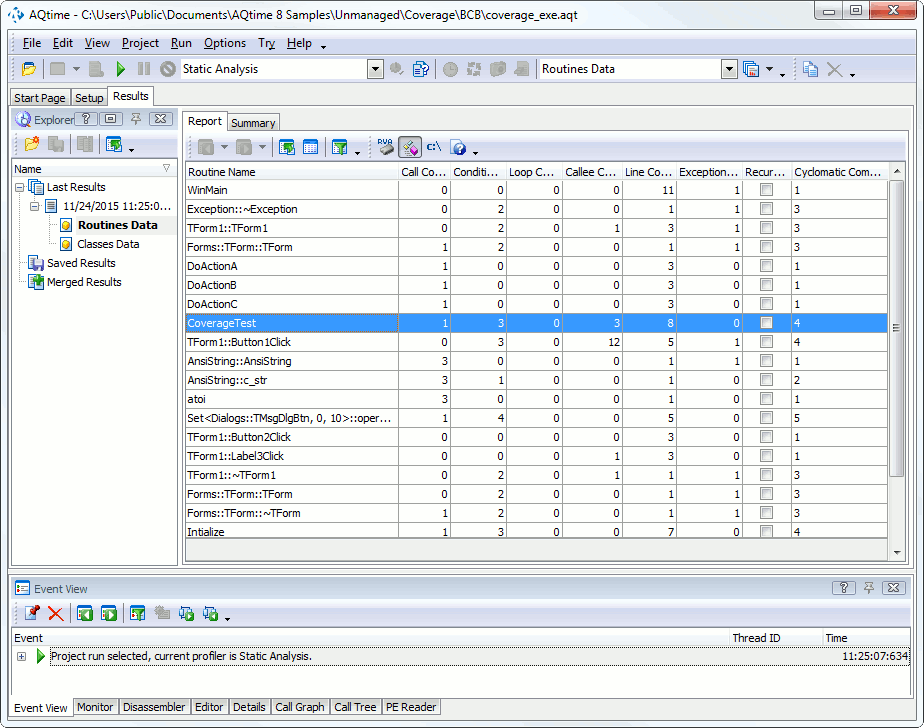
Each row in the Report panel corresponds to a routine that can potentially be called in your application. The columns of the panel contain detailed information about each routine. For example --
-
The Routine Name column displays routine names.
-
The Call Count column displays the number of potential calls of each routine.
For a full list of the available columns, see Static Analysis Profiler - Report Panel.
The panel’s footer can contain summary results for the values displayed in the columns. You can customize the summary type and summary format using the Format Columns dialog or the context menu that is brought up by right-clicking the column footer.
By default, the column summary is calculated for all the rows displayed in the Report panel. However, if you select two or more rows, AQTime will recalculate the summary for the selected rows only.
Editor Panel
If you double-click a routine in the Report panel, the cursor in the Editor panelCode EditorEditor will move to the source code of the corresponding routine (the path to the source file must be specified in the Search Directory or Project Search Directories dialog).
The Editor displays various profiling results as comments before the routine’s source code. To configure which columns you want to see in these comments, use the Customize Comments dialog.
Viewing the Hierarchy of Function Calls
For the Routines Data category, the Static Analysis profiler determines how routine calls are coded in the application's source code - what is called (child) from where (parent).
You can view the hierarchy of potential function calls (a parent-child hierarchy) for the routine currently selected in the Report panel in one of the panels described below.
Details Panel
The Details panel represents the structure of function calls that lets you see all possible parents and children of the method currently selected in the Report panel.
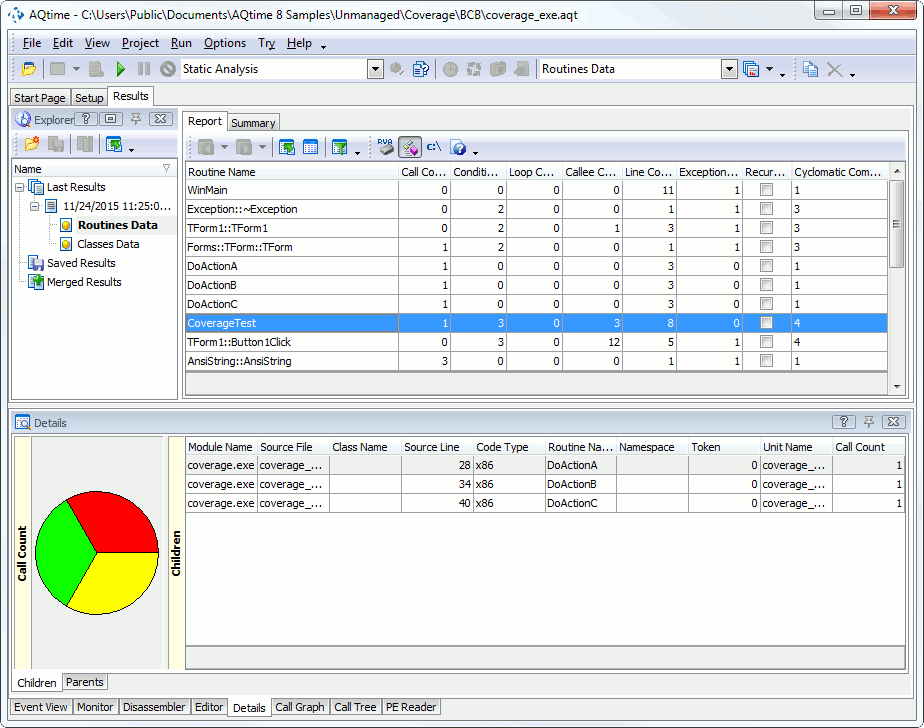
Below is a sample view of profiling results in the panel:
The Parents pane of the panel lists the routines that call the currently selected routine, while the Children pane lists all the routines that are called by the selected routine.
For more information on the results displayed in the Details panel and for the column description, see Routines Data Category.
Call Tree Panel
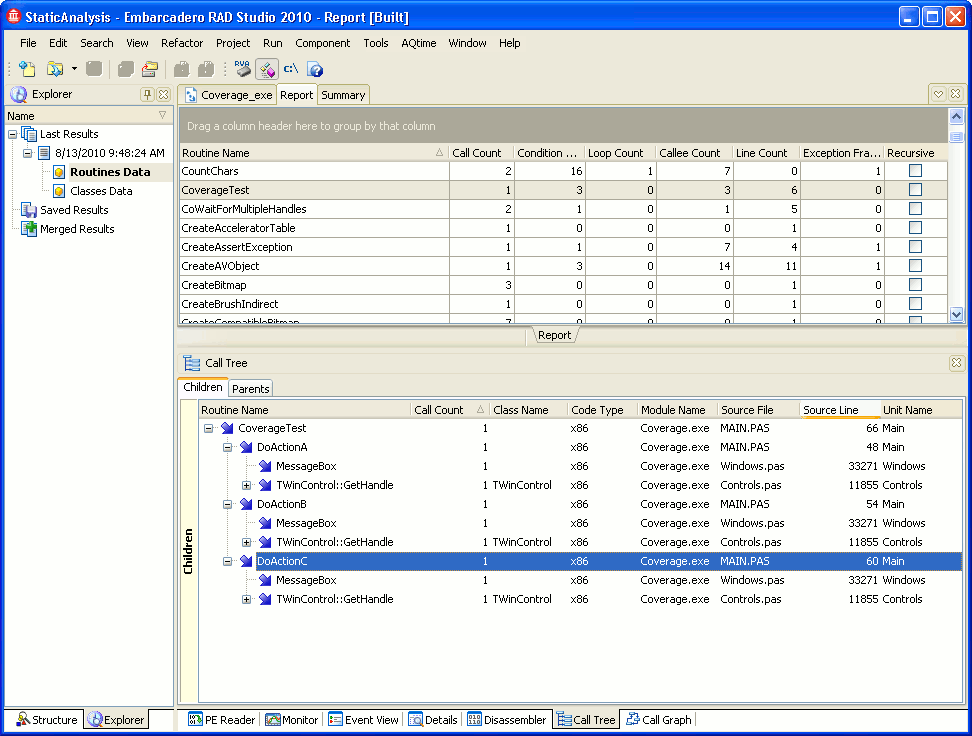
The Call Tree panel displays the hierarchy of potential routine calls. The image below shows how the hierarchy looks like in the Call Tree panel:
The Call Tree panel contains two panes: Parents and Children. The Parents pane displays all the function calls that call the currently selected routine. The Children pane displays the hierarchy of child calls that are initiated from the selected routine.
For more information on the results displayed in the Call Tree panel’s panes and for the column description, see Routines Data Category.
Call Graph Panel
The Call Graph panel displays the hierarchy of potential function calls in a convenient, visual format.
The method’s parent callers and child callees are shown in the panel with call counts (the number of points where calls occur in the source code).
The critical path to a routine is displayed in bold (a critical path is the "longest" path to a routine in the hierarchy of potential function calls, for instance, the one that has the greatest number of instructions). To select a value that will be used to calculate the critical path, use the Customize Call Graph dialog.
See Also
Static Analysis Profiler Results
Static Analysis Profiler
Static Analysis Profiler Results - Overview
Routines Data Category
Routines Data Category
Routines Data Category

 Viewing Profiling Results