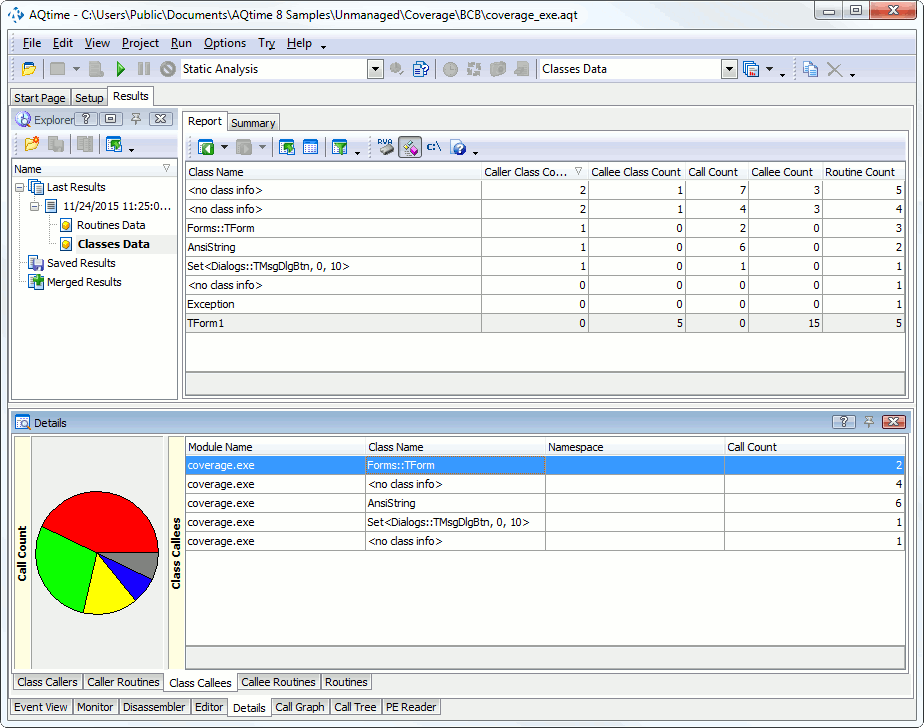
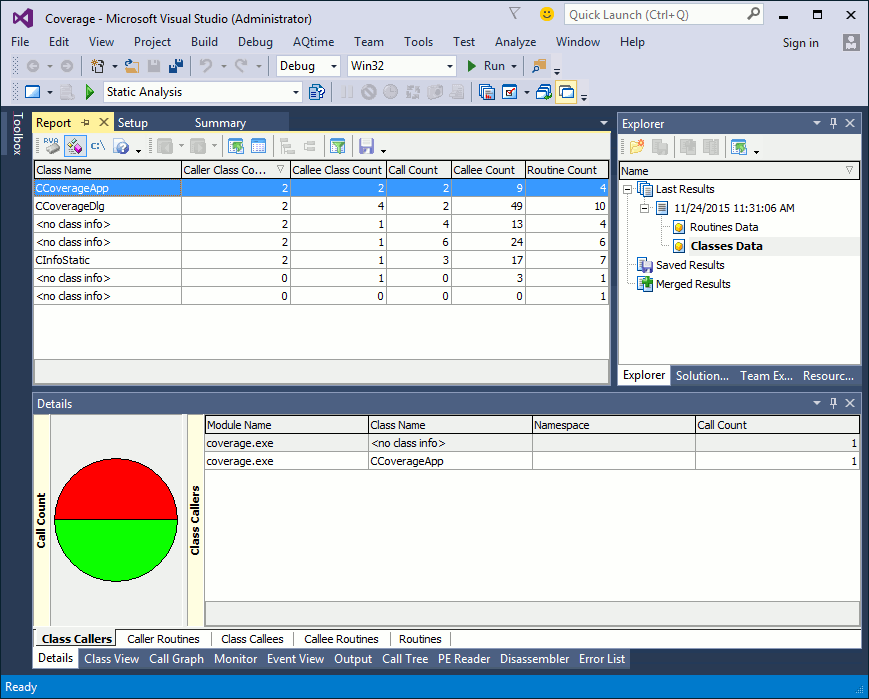
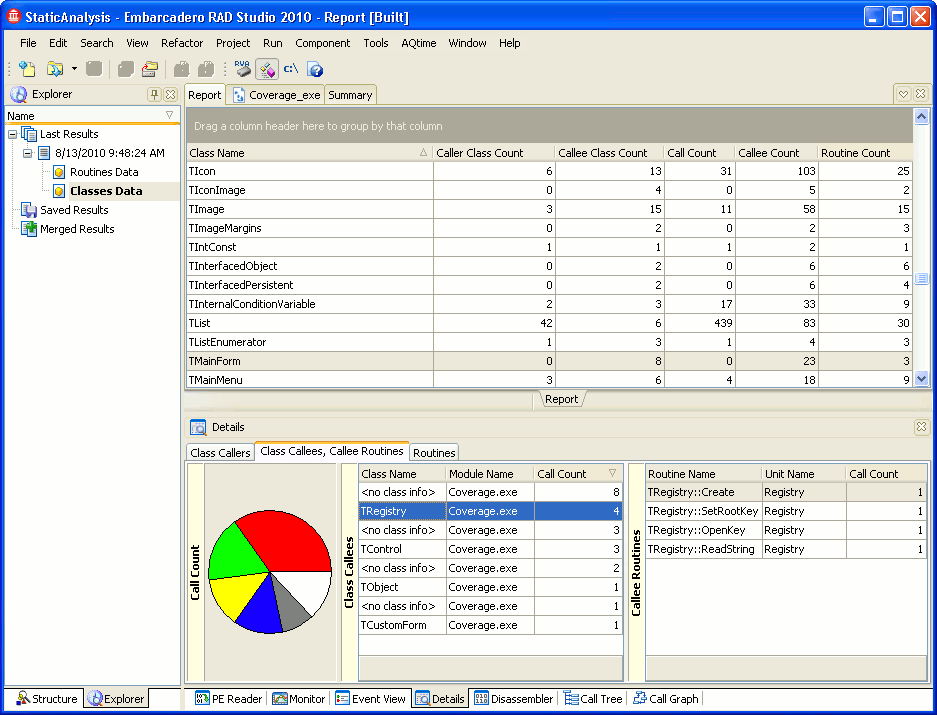
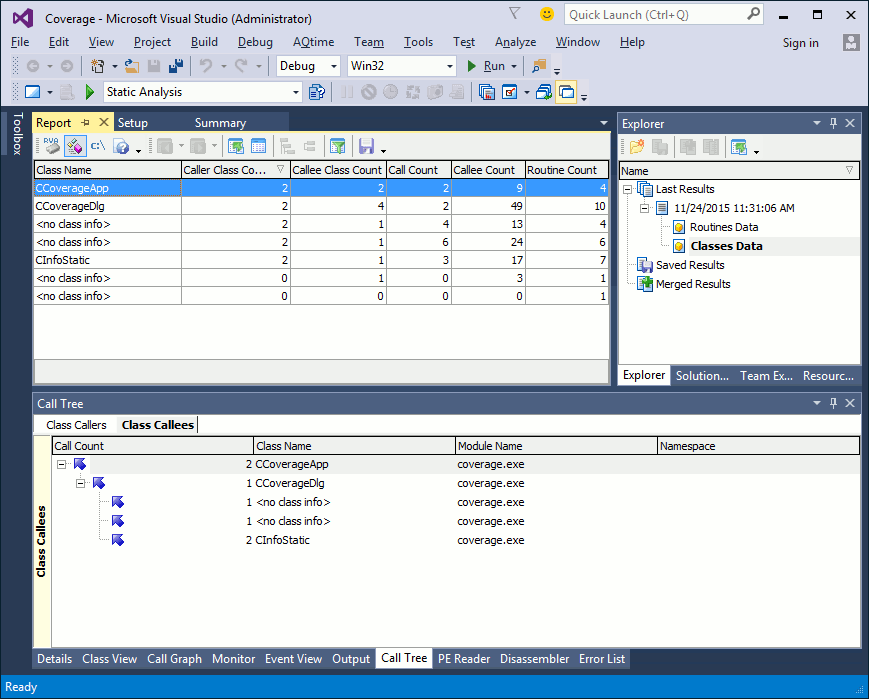
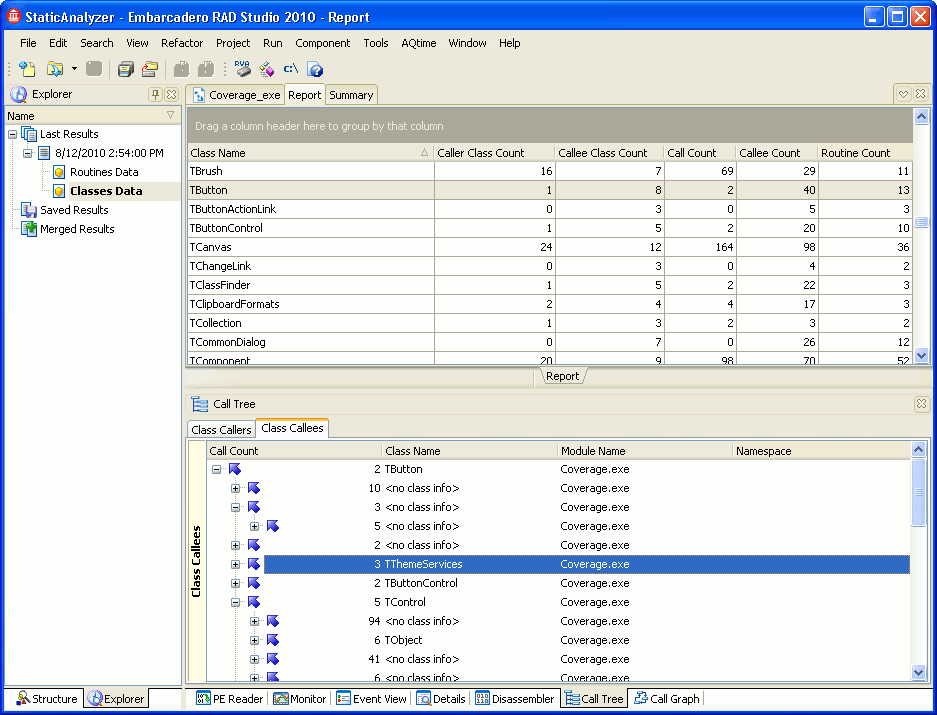
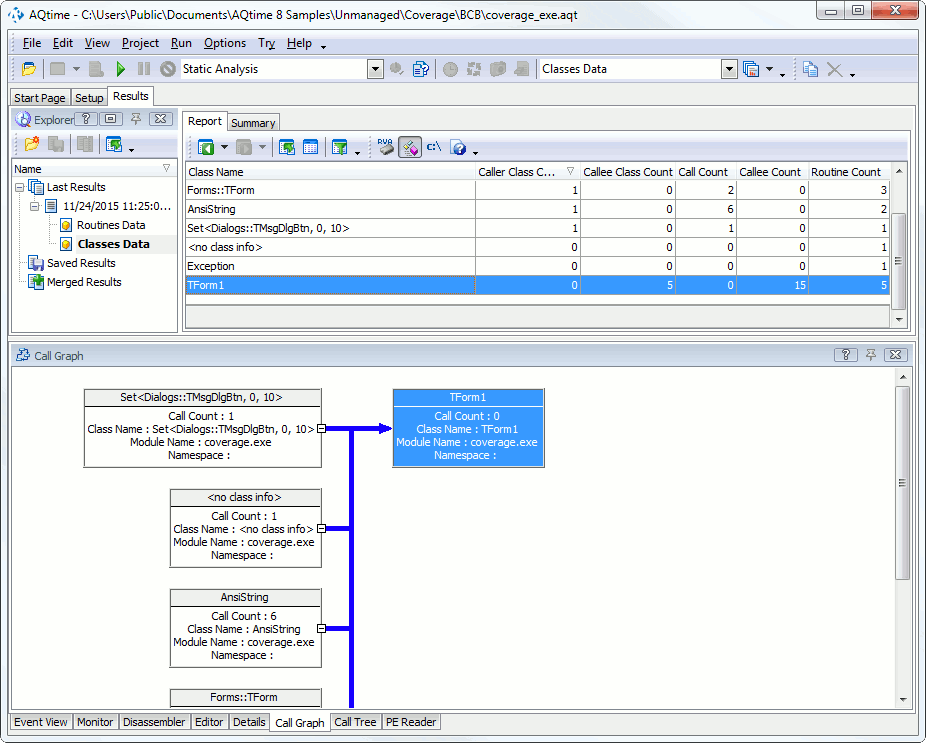
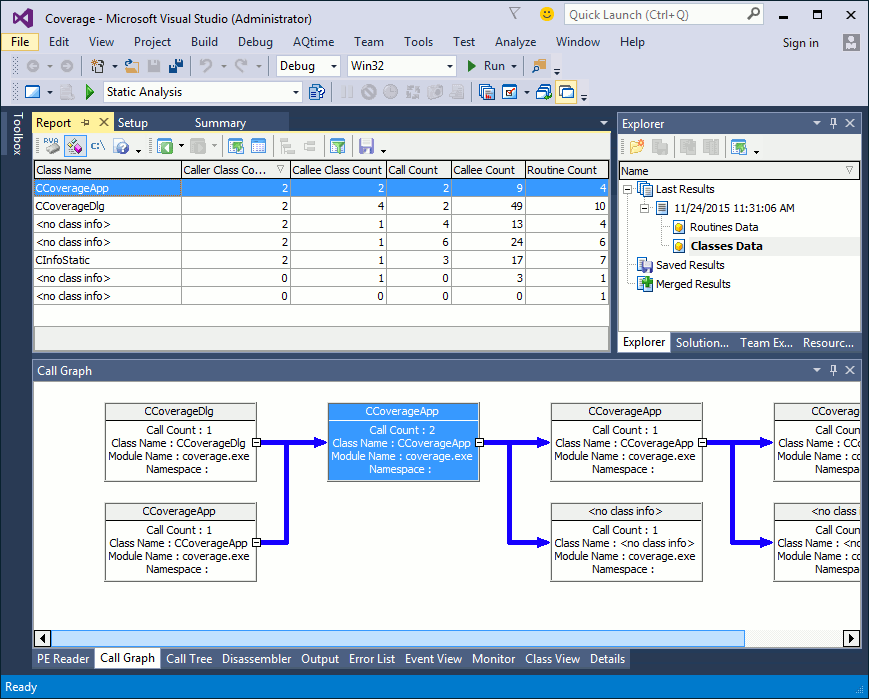
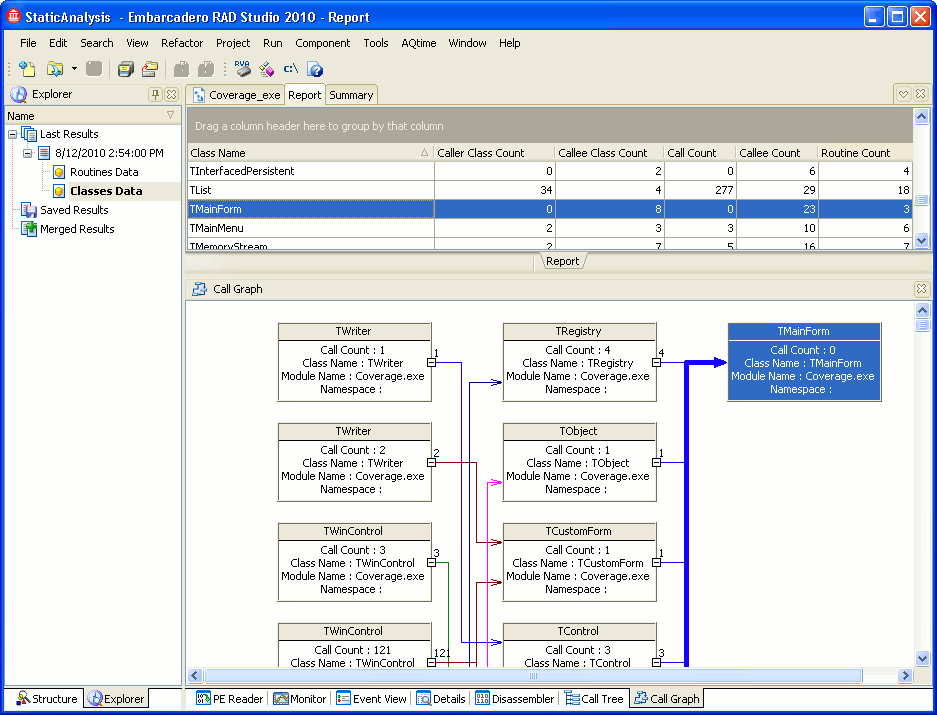
The results of the Static Analysis profiler are divided into two categories: Routines Data and Classes Data. When the Classes Data category is selected, the Report panel display information about class interlinks (through potential calls between class methods) in your application.
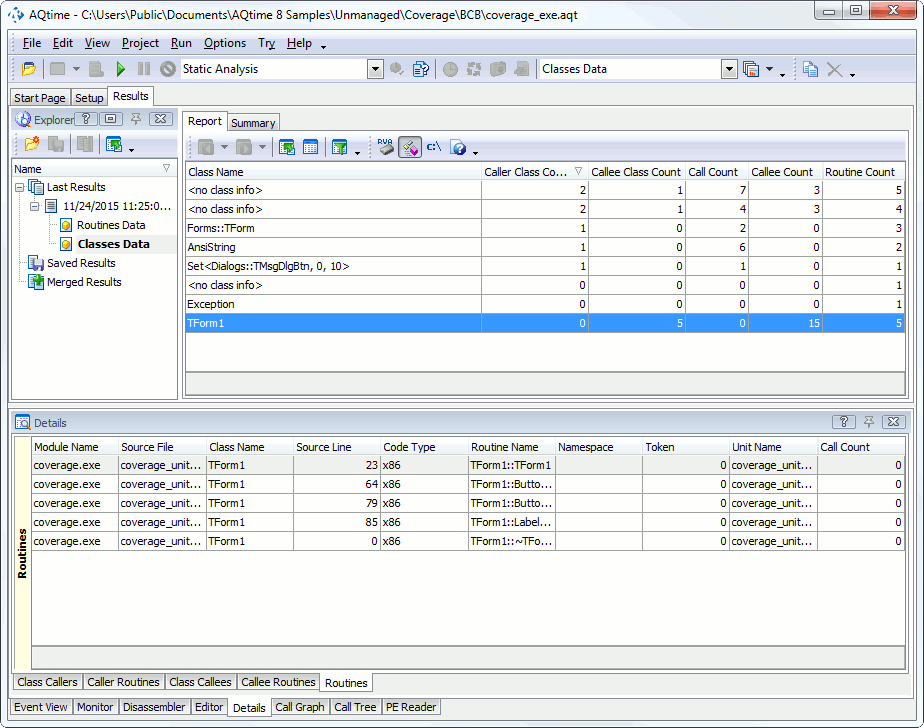
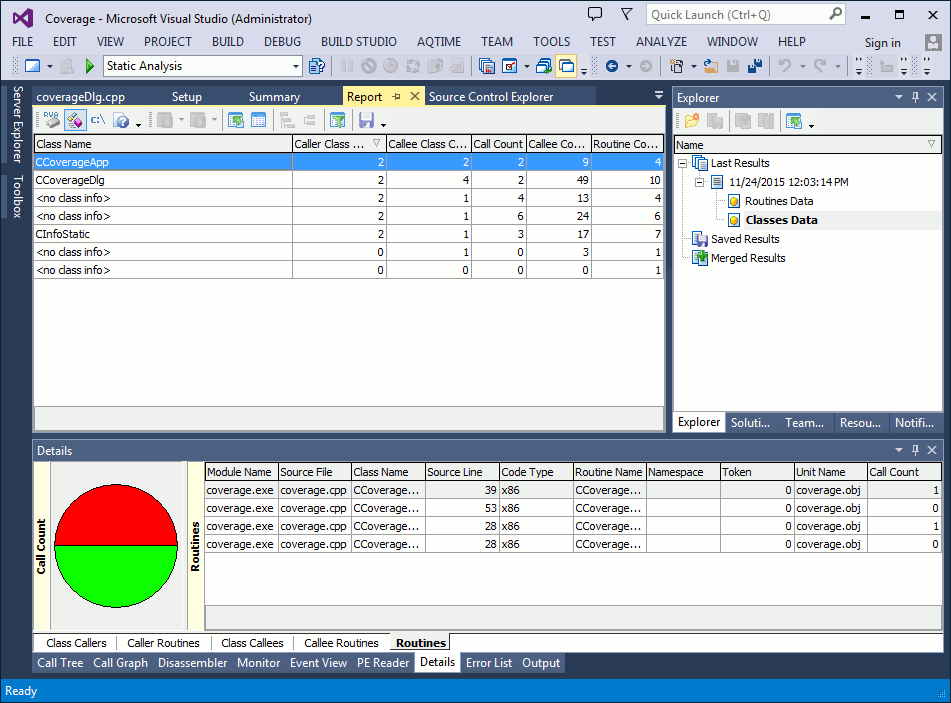
Below is a sample output of Static Analysis profiler results displayed in the Classes Data category:
This topic describes how to work with profiling results of the Classes Data category.
Viewing Profiling Results
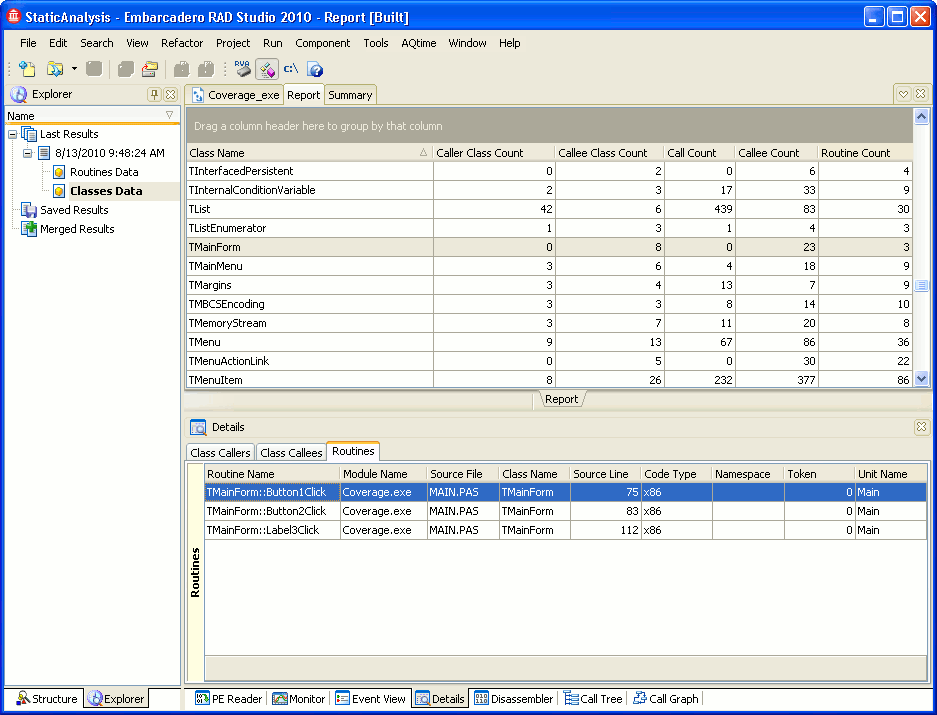
Each row in the Report panel corresponds to a class that is used in your application. The panel's columns contain detailed information about each class. For example --
-
The Class Name column displays classes’ names.
-
The Call Count column displays the number of calls to classes’s methods in the application code.
For a full list of the available columns, see Classes Data Category.
The panel’s footer can contain summary results for the values displayed in the columns. You can customize the summary type and summary format using the Format Columns dialog or the context menu that is brought up by right-clicking the column footer.
By default, the column summary is calculated for all rows displayed in the Report panel. However, if you select two or more rows, AQTime will recalculate the summary for the selected rows only.
Viewing the Hierarchy of Class Interlinks
You can view the hierarchy of potential interlinks between classes for the class currently selected in the Report panel in one of the panels described below.
Details Panel
The Details panel displays information on class interlinks for the class currently selected in the Report panel. This information is divided into several lists:
-
The Routines pane displays all the methods of the class that is currently selected in the Report panel.
-
The Class Callers pane lists classes whose methods call methods of the current class.
-
The Caller Routines displays all the methods of the class chosen in the Class Callers pane.
-
The Class Callees pane lists classes whose methods are called by methods of the current class.
-
The Callee Routines pane shows all the methods of the class chosen in the Class Callees pane.
Double-clicking a class line in either list (Class Callers or Class Callees) refreshes the Details and all other panels with the information on the chosen class.
For more information on the results displayed in the Details panel, as well as for the column description, see Classes Data Category.
Call Tree Panel
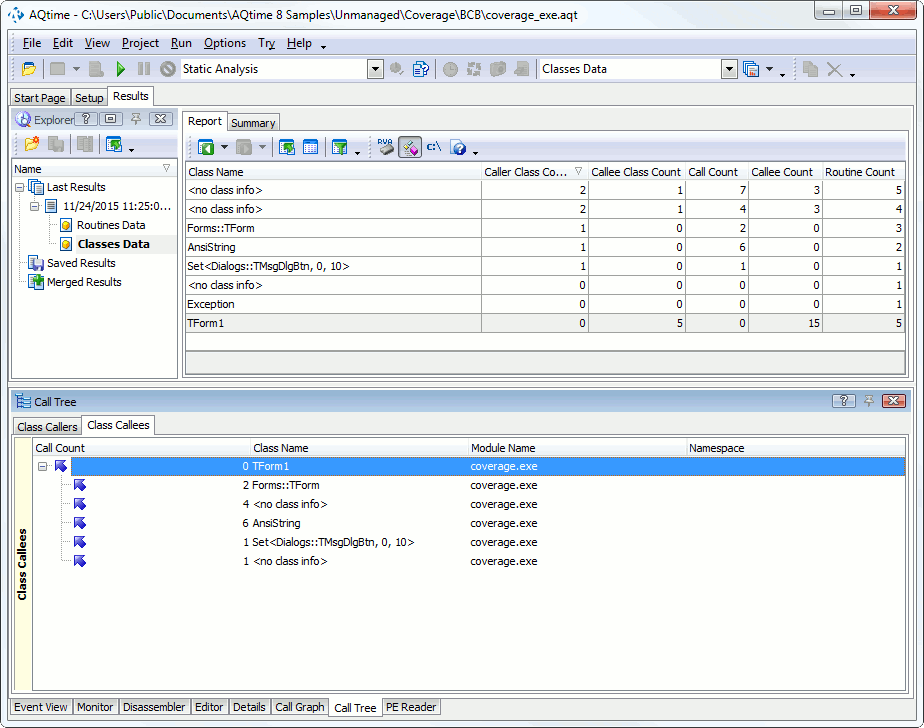
The Call Tree panel provides a tree-view of the hierarchy of potential class interlinks.
The Call Tree panel contains two panes: Class Callers and Cass Callees. The Class Callers pane contains the hierarchy of classes whose methods eventually call methods of the currently selected class. The Class Callees pane displays the hierarchy of classes calls to whose methods are initiated from the selected class.
The image below demonstrates how the hierarchy of class interlinks looks in the panel:
For more information on results displayed in the Call Tree panel and for the column description, see Classes Data Category.
Call Graph Panel
The Call Graph panel displays the hierarchy of method interlinks between classes.
The panel contains the classes whose methods call the methods of the class currently selected in the Report panel and the classes whose methods are called by the methods of the selected class.
You can travel up and down the hierarchy in the panel by double-clicking the rectangles of the desired classes.
See Also
Static Analysis Profiler Results
Static Analysis Profiler
Static Analysis Profiler Results - Overview
Classes Data Category
Classes Data Category
Classes Data Category

 Viewing Profiling Results