The Performance profiler traces the caller-callee relationships between functions and measures how much time the application spent executing a routine that was called from another routine. For example, if the fooA function calls the fooB function, the profiler will trace the call relationships and will report the execution time of the fooB function when this function was called from fooA. This functionality lets you explore the execution time of the parent and child functions in the Details panel.
However, in some cases, Performance profiler's panels may display the call sequences that do not exist, or they may report that a function was called several times while it was called only once. The following sections explains why the panels display misleading calls and describes how you can hide them from the profiling results.
Why the Profiler Displays Misleading Calls
The profiler uses the same collected data to build the call hierarchies in the Call Graph and Call Tree panels. However, to speed up the profiling and to save the amount of consumed memory, the profiler traces only the parent-child references. It does not collect information on grandparent or grandchild calls, that is, it does not save information on the call routes. This obstacle may cause the Call Graph and Call Tree panel to display “strange” results. For instance, the panels may display the call sequences that do not exist, or they may report that a function was called several times while it was called only once.
Suppose that our tested application contains the two following call routes:
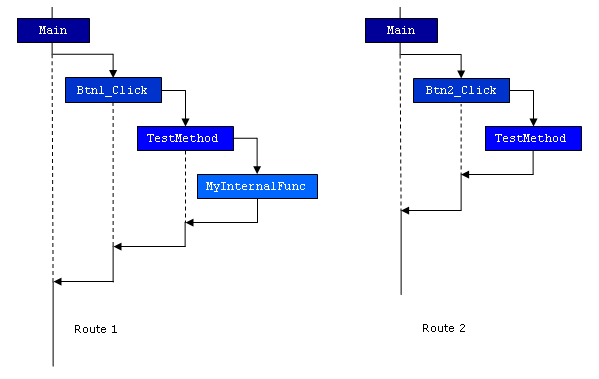
Both Btn1_Click and Btn2_Click functions are called from the Main routine. Both routines call the TestMethod function. The behavior of this function depends on the route. When TestMethod is called from Btn1_Click, it calls the MyInternalFunc function. When TestMethod is called from Btn2_Click, it does not call MyInternalFunc.
The Performance profiler traces the references between the Main, Btn1_Click, Btn2_Click, TestMethod and MyInternalFunc functions, but it does not collect the information for the call routes. So, when viewing results for the Main routine, in the Call Graph and Call Tree panels, you may note that the panels display calls that were not performed:
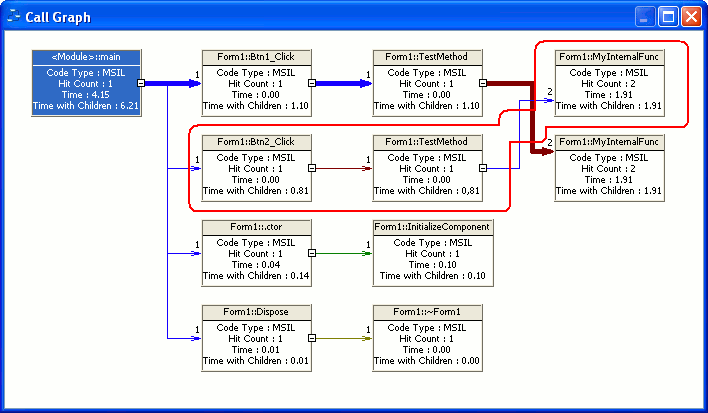
The Call Graph panel
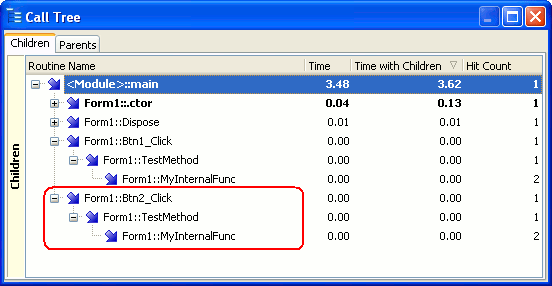
The Call Tree panel
As you can see, the panels display the following call route that does not actually exist:
Main -> Btn2_Click -> TestMethod -> MyInternalFunc
The panels display this route because the profiler does not collect information on the routes. It only gathers information on caller-callee relationships and uses this information to build the call hierarchies in the Call Graph or Call Tree panels.
How to Hide Misleading Calls From the Results
The misleading calls cannot be hidden from the Call Tree panel. As for Call Graph, you can change the panel’s settings to hide misleading calls:
-
One possible way to hide misleading calls is to decrease the Call Graph’s Number of child levels option to 2 or 1. In this case, the “grandchild” calls are not displayed in the panel.
-
Another way to hide misleading calls from the Call Graph panel is to open the Customize Call Graph dialog and enable the Show cycling connections option in it (to call the dialog, right-click somewhere in the Call Graph panel and select Customize from the context menu). However, in this case the Call Graph will display empty results for some routines:
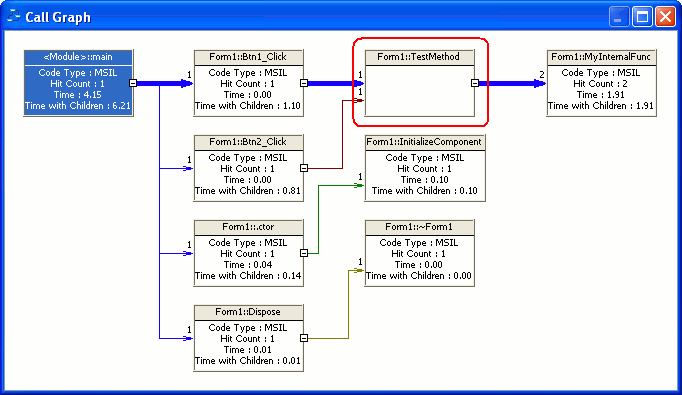
The function’s rectangle is empty, because the panel cannot determine which route’s results should be displayed.
If you double-click the
TestMethodfunction, the Call Graph will display profiling results in the function’s rectangle. This happens becauseTestMethodbecomes the currently selected routines and the Call Graph displays the same values that are shown for this routine in the Report panel: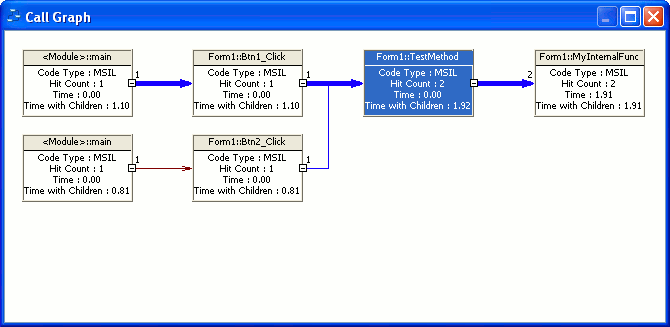
The described problem exists when the Call Graph and Call Tree panels display results of the Performance profiler. AQTime includes the Function Trace profiler that traces the call routes, so you can use this profiler to analyze the execution routes in your application. Function Trace works slower in comparison to the Performance profiler, however, it provides correct route-relative information while the Performance profiler provides a general map of parent-child calls.
See Also
Performance Profiler - Overview
About the Call Graph Panel
About the Call Tree Panel
Function Trace Profiler - Overview

 Why the Profiler Displays Misleading Calls