
After the profiling run is over, AQTime displays detailed information about profiling results. The following sections provide a brief overview of results and panels that hold them and explain how to filter and merge results.
 Viewing Summary Profiling Results
Viewing Summary Profiling Results
Brief results of the Light Coverage profiler are displayed in the Summary panel. It shows ten routines that were covered less than the other application routines:

Click the image to enlarge it.

Click the image to enlarge it.

Click the image to enlarge it.
Viewing Detailed Information
Information for individual application routines, source files and modules is displayed in the Report panel. Here is an example of the Light Coverage profiler output:

Click the image to enlarge it.

Click the image to enlarge it.

Click the image to enlarge it.
As you can see, results are organized into three categories: Routines Data, Source Files Data and Modules Data. The Source Files Data and Modules Data categories let you view summary profiling results for each source file and module in your application. The Routines Data category contains results for each single routine included in profiling tasks.
To view profiling results, choose the desired category on the Explorer panel and switch to the Report panel. You can also select the category from the Result Items box:
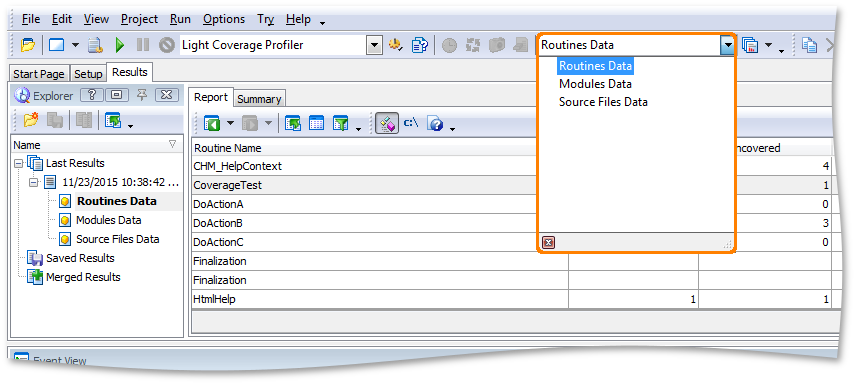
After you chose the desired category, AQTime will update the Report panel. The contents of this panel depend on the currently selected category:
-
Routines Data
If selected, the Report panel displays profiling results one routine per line. Line coverage results will be shown in the Lines page of the Details panel and in the Editor’s grid.
We would like to note that to profile code at the line level, you should add the desired routines, classes, files or modules to a line-level profiling area (see Profiling Levels). Also, to profile managed routines at the line level, you have to compile the application with debug information (see How AQTime Profilers Use Metadata and Debug Information).
For a detailed description of results displayed under the Routines Data category, see Results of the Routines Data Category.
-
Source Files Data
If selected, each row in the Report panel shows profiling results for a source file. The Editor panel displays the source code of the selected file. The Details panel displays line profiling results.
The panel displays results for those lines that were included in profiling tasks (that is, for lines that belong to routines, classes or files that were included in a profiling area of the line-level type).
For a detailed description of results displayed under the Source Files Data category, see Results of the Source Files Data Category.
-
Modules Data
If selected, each row in the Report panel displays profiling results for one module. The other panels that provide additional information on profiling results are not used.
For a detailed description of results displayed under the Modules Data category, see Results of the Modules Data Category.
How to Filter and Merge Results
-
You can quickly filter out routines whose source code lines were covered partially (less than specific percentage). To do that, use the predefined result views Routines covered less than %nn. On the other hand, using the Unexecuted routines only predefined view, you can display routines that were not executed at all. You can select any of these views from the Result Views dropdown list on the Standard toolbar or from the View > Result View menufrom the Result Views dialog. To display it, choose AQTime > Result Views from Visual Studio’s menufrom the Result Views dialog. To display it, click the
 Result Views button. Note that this button does not reside on any toolbar by default. However, you can add the button to any RAD Studio’s toolbar via the Toolbar Customization dialog. In this dialog, switch to the Commands page, select the View.AQTime category in the Categories list, drag the Result Views command from the Commands list and drop it on the needed toolbar. For more information, see Result Views.
 -
After you have run the Light Coverage profiler several times, you can merge profiling results to get mass statistics. Merging can be executed directly from the context menu of the Explorer panel (using the
 Merge item) or done automatically in the background after each profiling run (using the Auto-merge option of the Explorer panel). You can also compare results of several Light Coverage profiler runs in order to see changes. For more information on comparing and merging results, see Comparing Results and Merging Results.
By default, this item is hidden. To add it:
-
Right-click any AQTime toolbar and select Customize from the context menu.
-
In the Customize dialog, open the Commands tab and select the Standard category.
-
Drag the Result Items command to the desired toolbar and then close the dialog.
See Also
Report Panel
Details Panel
Call Graph Panel
Call Tree Panel
Light Coverage Profiler