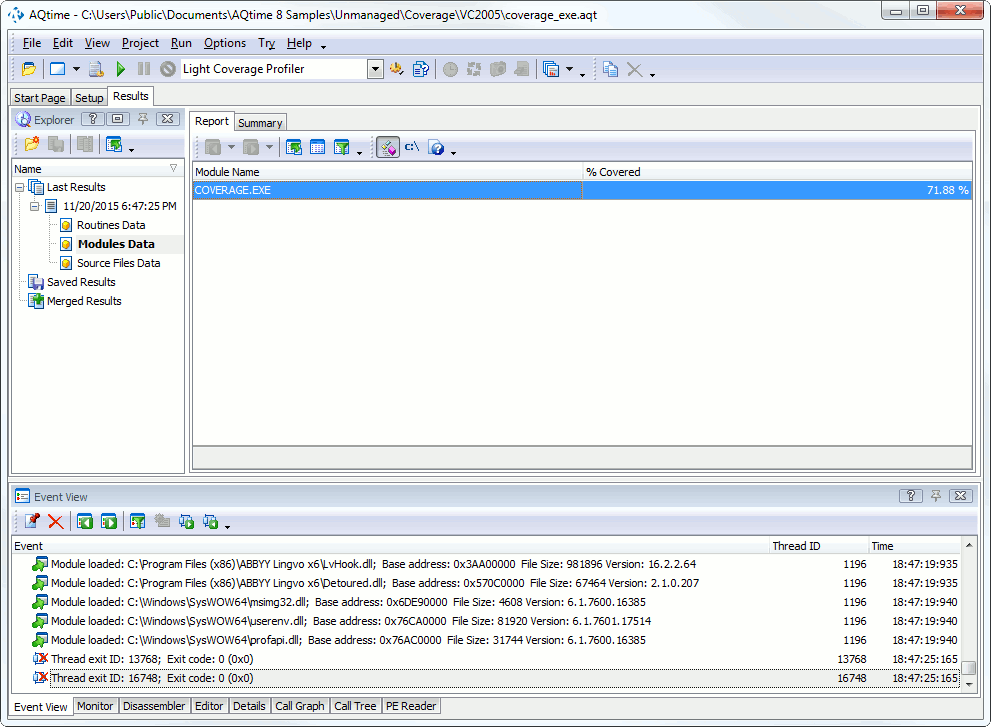
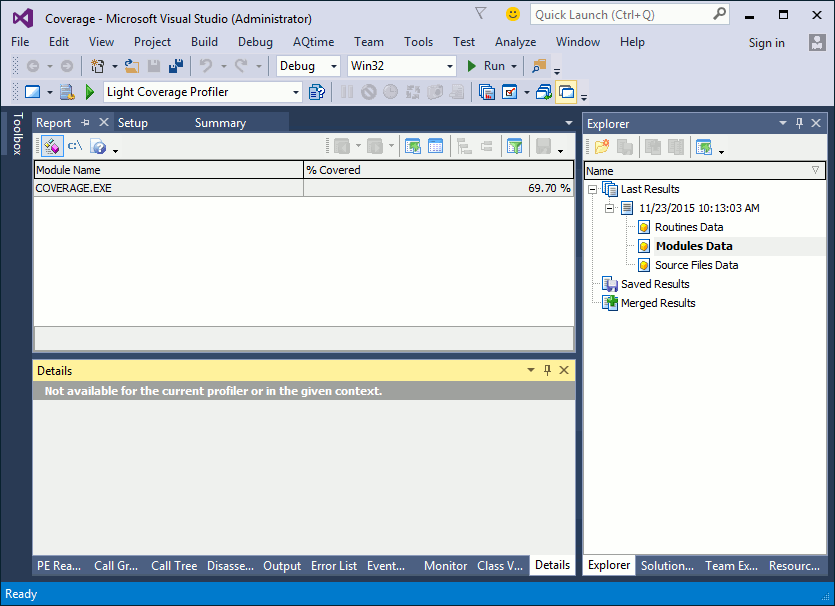
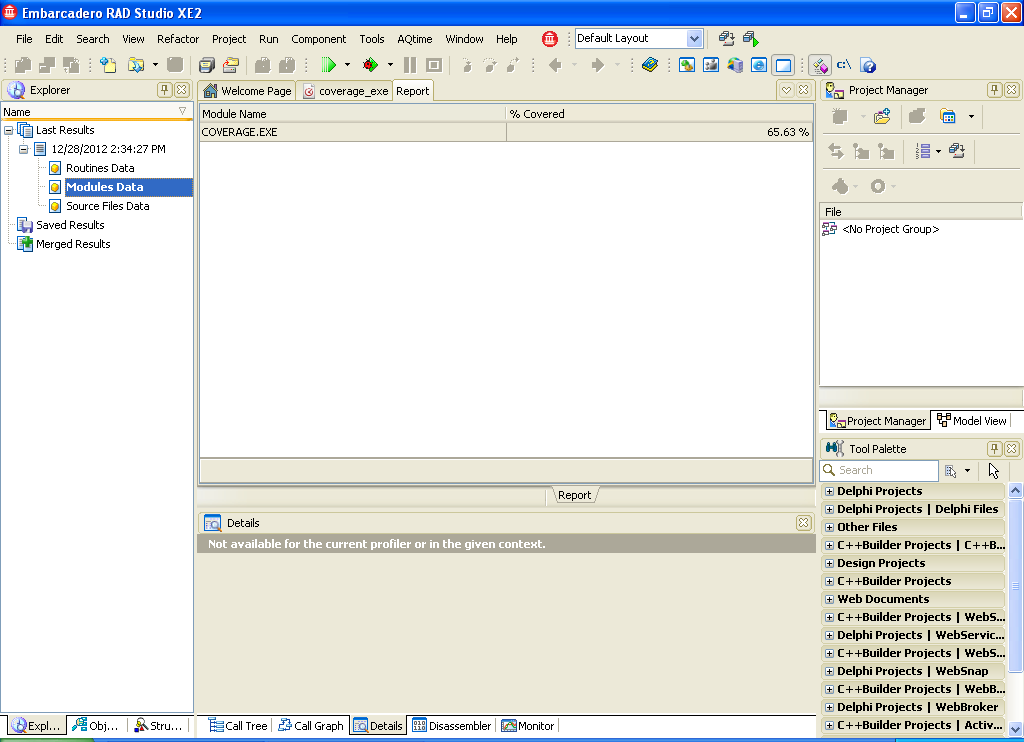
The Light Coverage profiler results are divided into three categories: Routines Data, Modules Data and Source Files Data. When the Modules Data category is selected, each row in the Report panel corresponds to a single module of your application.
Below is a sample output of Light Coverage profiler results displayed in the Modules Data category:
Each row in the Report panel contains results for an individual application module:
-
Module names are specified in the Module Name column.
-
The % Covered column shows the overall percentage of covered lines in the given module. Use the value of this column to estimate whether your automated tests completely cover individual application modules.
For a detailed description of all available columns refer to Light Coverage Profiler Panels Reference.
See Also
Light Coverage Profiler
Report Panel
Explorer Panel
Analyzing Profiler Results


